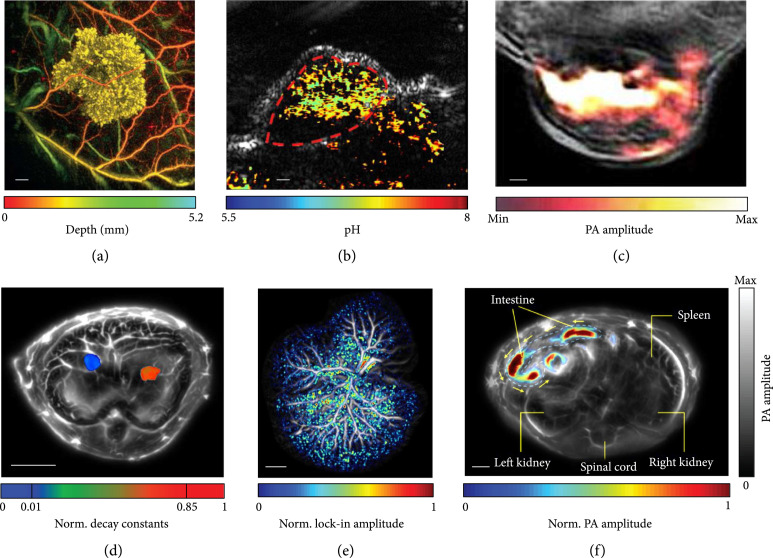
Figure 4.
Representative images of molecular PACT. (a) In vivo PA images of Tyr-expressing K562 cells after subcutaneous injection into the flank of a nude mouse (vasculature is color-coded for depth; K562 cells are false-colored yellow). Scale bar, 1 mm [64]. (b) Quantitative PACT of pH in vivo. Functional PA image in pseudo-color is superimposed on the gray-scale ultrasound image. Scale bar, 2 mm [72]. (c) In vivo PA image of a 4T1 tumor-bearing mouse, given a single injection of 150 μg of OMVMel via the tail vein. The image was acquired at 3 h postinjection, showing the accumulation of OMVMel in tumor tissue, where the OMVMel is in color and the background tissue is in gray [73]. (d) In vivo multicontrast PACT of two types of tumor cells in the liver. Two types of tumors expressing different photoswitchable proteins are separated by their decay characteristics. The tumors are shown in color, and the background tissues are shown in gray. Norm.: normalized [74]. (e) PA image of a hydrodynamic-transfected liver. The photoswitching signals are shown in color, confirming the existence of reconstituted DrSplit induced by protein-protein interactions. The background tissues are shown in gray [74]. (f) PA image of the microrobots in the intestines in vivo. The migrating microrobots are shown in color, and the mouse tissues are shown in gray. The yellow arrows indicate the direction of migration [76].

