Figure 5.
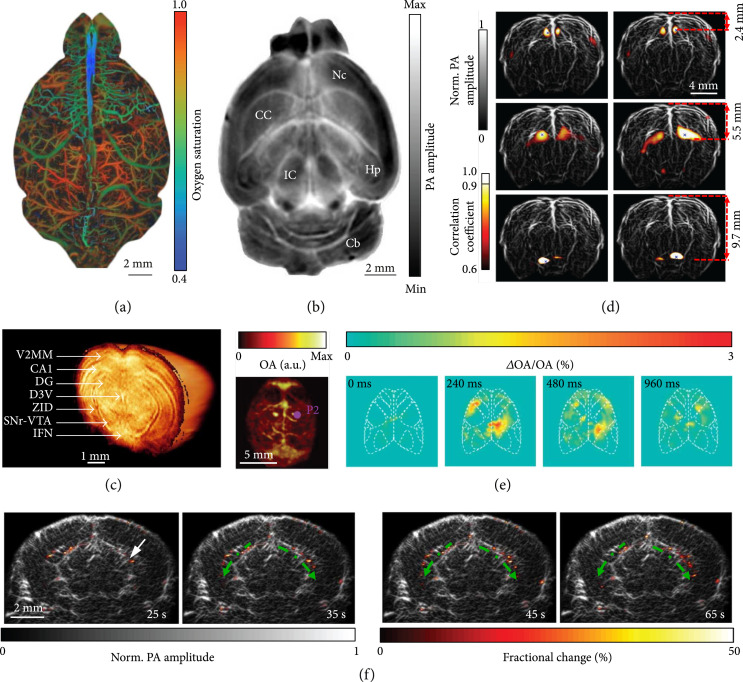
Multiscale PAT of the brain. (a) PAM of oxygen saturation of hemoglobin in a mouse brain [79]. (b) A cross-sectional PACT image of a saline-perfused mouse brain (horizontal plane) at 2.8 mm depth, showing internal structures of the brain clearly. Nc: neocortex; CC: corpus callosum; Hp: hippocampus; Cb: cerebellum; IC: inferior colliculus [80]. (c) 3D PACT image of a mouse brain ex vivo. Illumination wavelength: 740 nm; V2MM: secondary visual cortex, medio-medial; CA1: hippocampal CA1 area; DG: dentate gyrus; D3V: dorsal third ventricle; ZID: zona incerta dorsal; SNr: substantia nigra reticulate; VTA: ventral tegmental area; IFN: interfascicular nucleus [81]. (d) Functional mapping of the resting-state connectivity in a rat whole brain (coronal plane), showing a clear correlation between corresponding regions across the left and right hemispheres [58]. (e) PACT of GCaMP6s responses to electrical stimulation of the right or left hind paw. First from the left, maximum amplitude projection along the depth direction of the 3D images of a GCaMP6-expressing mouse; second to last, relative increases in PA signal with respect to the baseline for a slice at ~1 mm depth at different time points following the stimulation pulse for the GCaMP6s-expressing mouse [82]. (f) PACT images of epileptic activities during a seizure at different times. The fractional changes (color) in the PA amplitude are overlaid on the anatomical image (gray, Bregma: −1.0 mm). The arrow indicates the injection site, and the dashed green arrows indicate the epileptic wave propagation direction [83].

