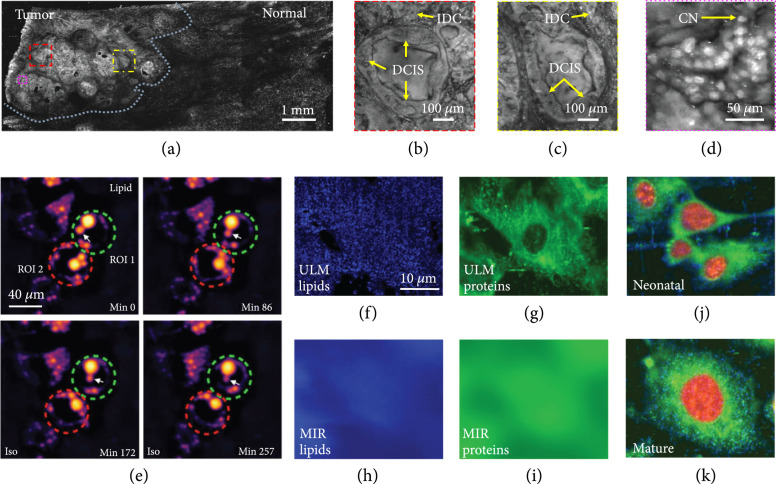
Figure 6.
Broad-spectrum PAM of tissues and cells. (a) PAM image of a fixed, unprocessed breast tumor. Illumination wavelength, 266 nm [88]. (b-d) Zoomed-in PAM images of the red, yellow, and magenta dashed regions in (a), respectively. IDC: invasive ductal carcinoma; DCIS: ductal carcinoma in situ; CN: cell nuclei [88]. (e) Monitoring intrinsic lipid contrast during lipolysis in differentiated 3T3-L1 adipocytes at 2,857 cm−1. Two regions of interest (ROIs) enclosing individual adipocytes are marked: green dashed circle for ROI 1 and red dashed circle for ROI 2. The white arrow follows the process of lipid droplet remodeling in a single adipocyte enclosed in ROI 1 [91]. (f, g) ULM-PAM images of lipids (f) and proteins (g) [85]. MIR-PAM images of lipids (h) and proteins (i), imaged at 3,420 nm and 6,050 nm, respectively [85]. Composite images of cells formed by overlaying the images of lipids (blue), proteins (green), and nucleic acids (red) in different color channels at neonatal (j) and mature (k) stages [85].

