Figure 7.
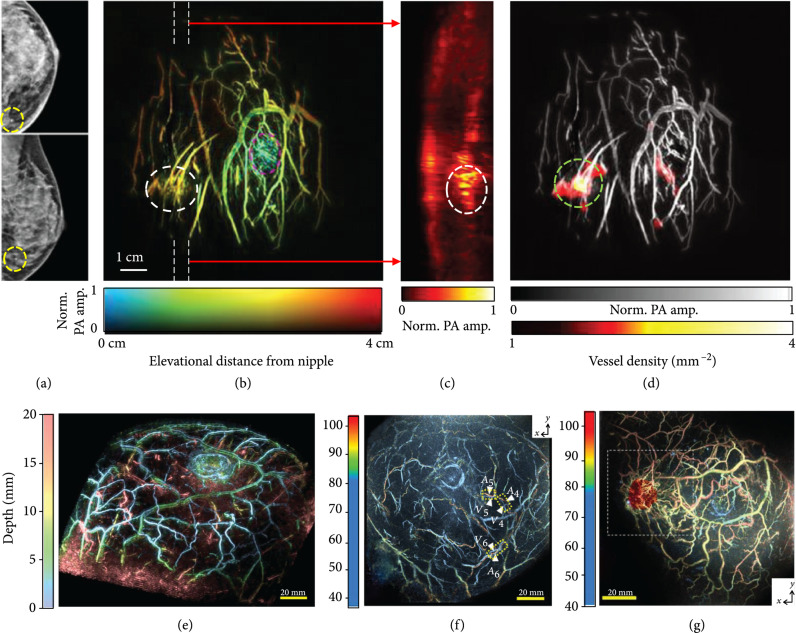
PACT of human breasts. (a) X-ray mammograms of an affected breast [94]. (b) Depth-encoded angiogram of the affected breast acquired by SBH-PACT. The breast tumor is identified by a white circle; the nipple is marked by a magenta circle [94]. (c) Maximum amplitude projection (MAP) images of the thick slice in sagittal planes marked by white dashed lines in (b) [94]. (d) Automatic tumor detection on vessel density maps. Tumors are identified by green circles. Background images in gray scale are the MAP of vessels deeper than the nipple [94]. (e) Depth-encoded 3D PACT image of a healthy breast [95]. (f) Evaluation of the S-factor in a healthy breast, where the color represents the measured S-factor [96]. (g) A fusion image of the S-factor and 3D-US images (red color) [96].

