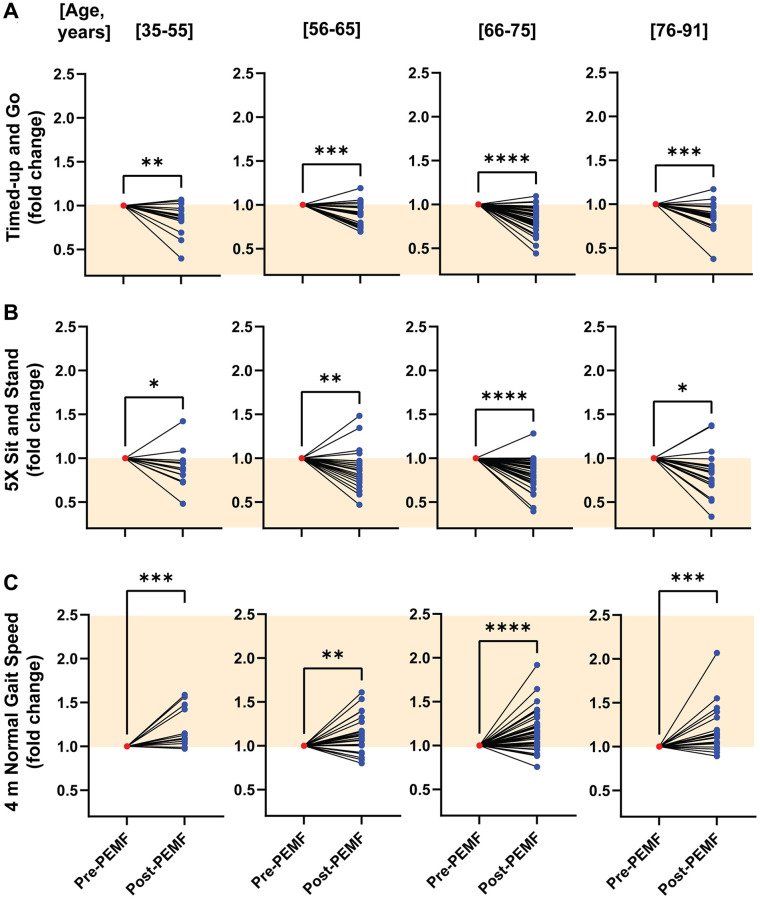
Figure 3.
Normalized age-stratified changes in mobility function before and after PEMF therapy. Fold change improvements for the (A) TUG, (B) 5xSTS and (C) 4mNGS tests after 12 weeks of PEMF therapy. Data was normalized to the respective baseline score for each subject. The orange-shaded regions depict the direction of improvement in mobility function for each test scenario. Statistical analysis was carried out using the Wilcoxon matched-pairs signed rank test, with *p < 0.05, **p < 0.01, ***p < 0.001 and ****p < 0.0001. For more information on the total number of responders and non-responders to PEMF therapy, refer to Supplementary Figure 2.

