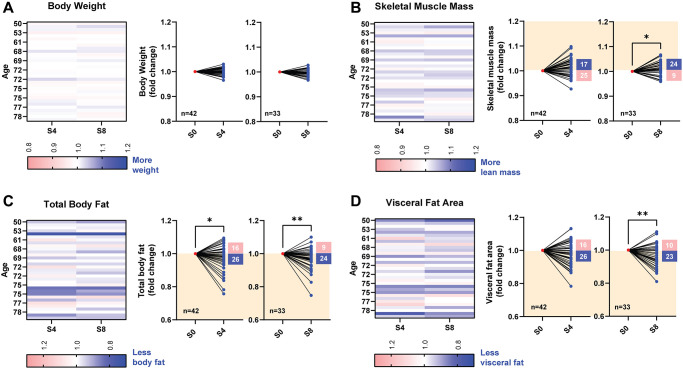
Figure 4.
Changes in body composition before and after 4 and 8 weeks of PEMF therapy. Body composition assessments were performed using bioelectrical impedance analysis with an InBody device at baseline (pre-PEMF), and after 4 (S4; n = 42) and 8 (S8; n = 33) sessions of weekly PEMF exposure. (A) Changes in body weight, expressed as fold change over baseline measured after 4 and 8 weekly PEMF sessions. Fold changes in skeletal muscle mass (B), total body fat (C) or visceral fat area (D) following PEMF therapy normalized to the respective baseline score for each subject (also see Supplementary Figure 3). The normalized before-after muscle and fat plots depict the fold change over baseline after 4 (S4) and 8 (S8) sessions of weekly PEMF exposure. The orange-shaded regions depict the direction for fold change improvement for each compositional assessment. The number of subjects for each trend direction is indicated in the corresponding box. Statistical analysis was carried out using the Wilcoxon matched-pairs signed rank test, with *p < 0.05 and **p < 0.01.

