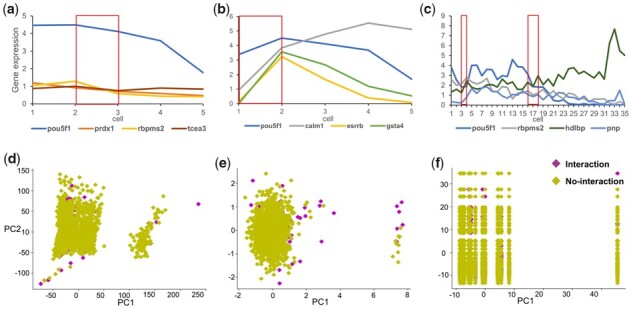
Figure 3.

Effectiveness of GEM. Average gene expression of each 100 cells. (a) The scRNA-seq data without timing information. (b) The scRNA-seq data with pseudo-timing information. (c) The scRNA-seq data with timing information. In all three cases, pou5f1 was selected as the TF. (d–f) The plot of the 2D PCA. The 500_Nonspecific-ChIP-seq-network_ mESC-GM dataset was processed by three different input generation methods. The PCA function is provided by scikit-learn (Pedregosa et al. 2011) and we use its default parameter values. (d) The 2D plot of scRNA-seq data processed by the input generation method of CNNC. (e) The 2D plot of scRNA-seq data processed by the input generation method of DGRNS. (f) The 2D plot of scRNA-seq data processed by GEM
