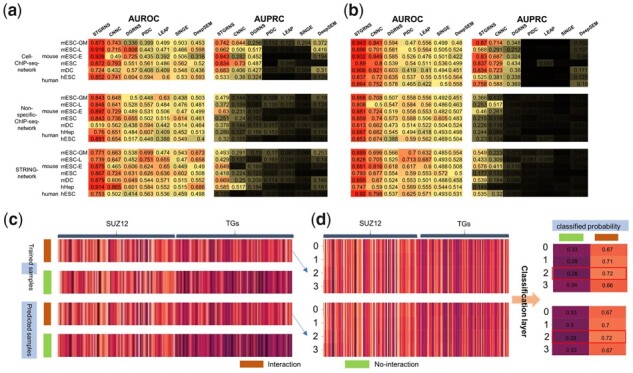
Figure 4.

Comparison of STGRNS with other methods and the interpretation of STGRNS on the GRN reconstruction task. (a) Comparison results on the top 500 highly variable genes datasets. (b) Comparison results on the top 1000 highly variable genes datasets. (c) Heatmap of true positive prediction samples after pooling layer in training datasets and test datasets. (d) Heatmap of the trained interaction samples and predicted interaction samples after the encoder layer and let each sub-vector pass through the classification layer to get the probability that each sub-vector is classified as 1
