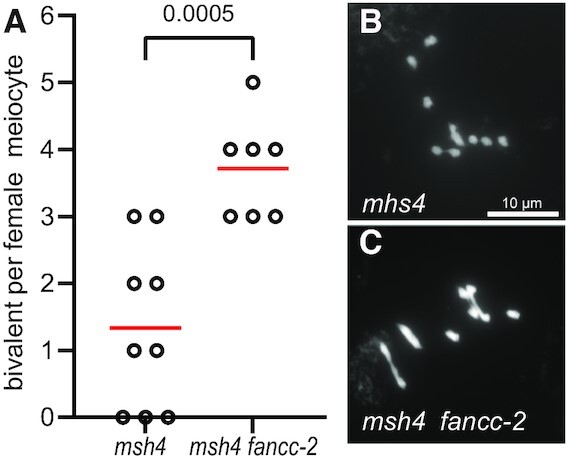
Figure 4.

Metaphase I chromosome spreads of female meiocytes. (A) Quantification of bivalents at female metaphase I. Each dot indicates the bivalent number of individual meiotic cells. The mean bivalent number for each genotype is shown by a red bar. (B) Female msh4 meiocyte with one bivalent. (C) Female fancc-2 msh4 meiocyte with four bivalents. Scale bar, 10 μm.
