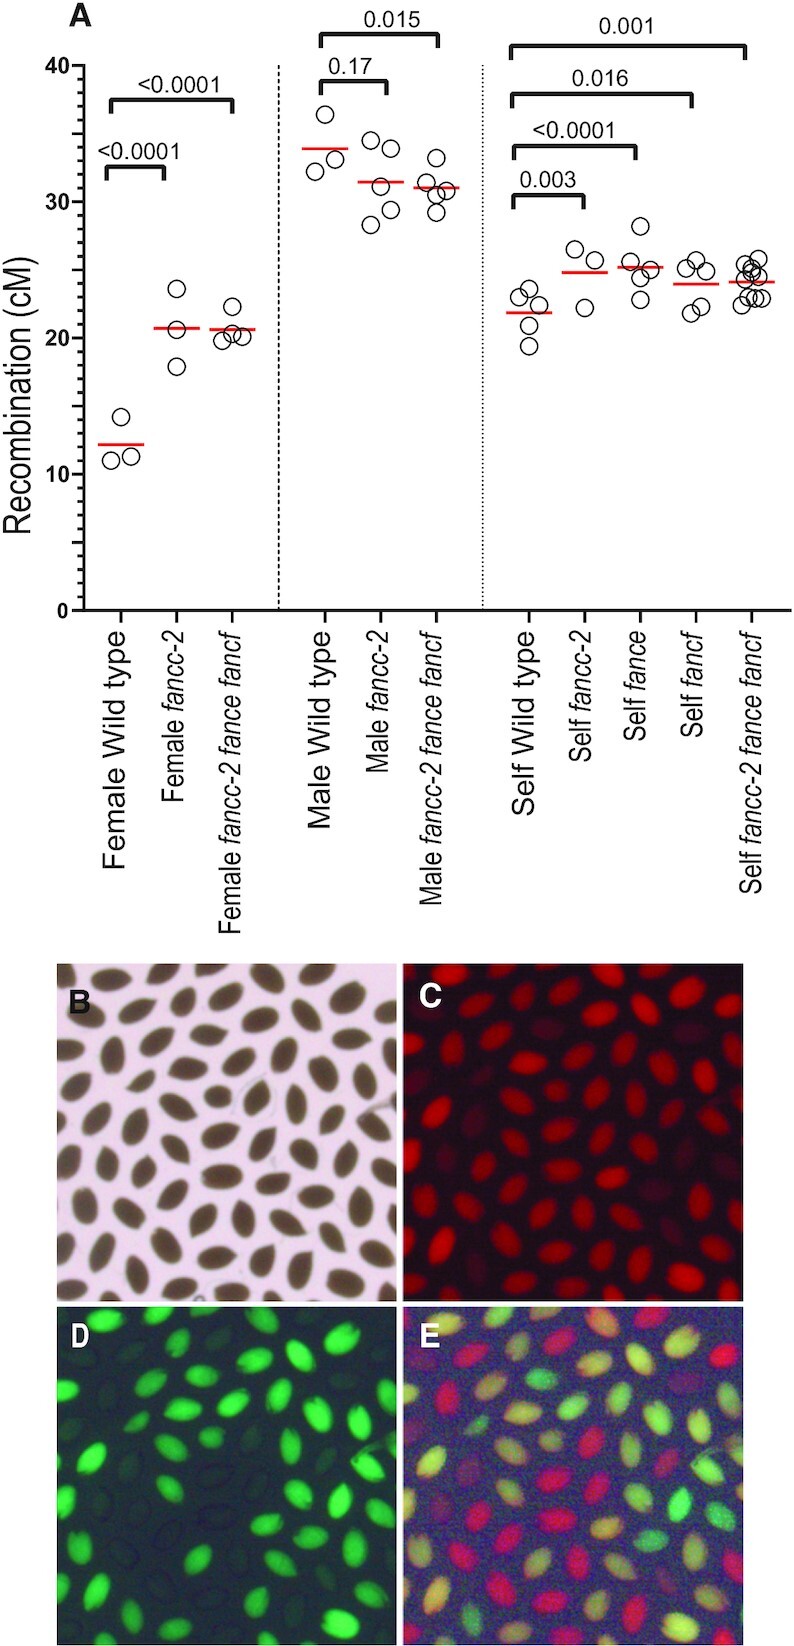
Figure 5.

Recombination in fancc, fance and fancf mutant. (A) Recombination was measured in seeds produced by crosses with wild type (female and male) or after selfing. Each dot represents the recombination frequency measured in an individual plant, and the red lines show the mean. P values are from two-sided Fisher's exact test on the proportion of recombined seeds. Raw data are shown in Supplementary Table S3 (B–E). Representative image of seeds from a 420/++ hemizygote imaged under bright-field, red fluorescence channel, green fluorescence channel, and merged fluorescence.
