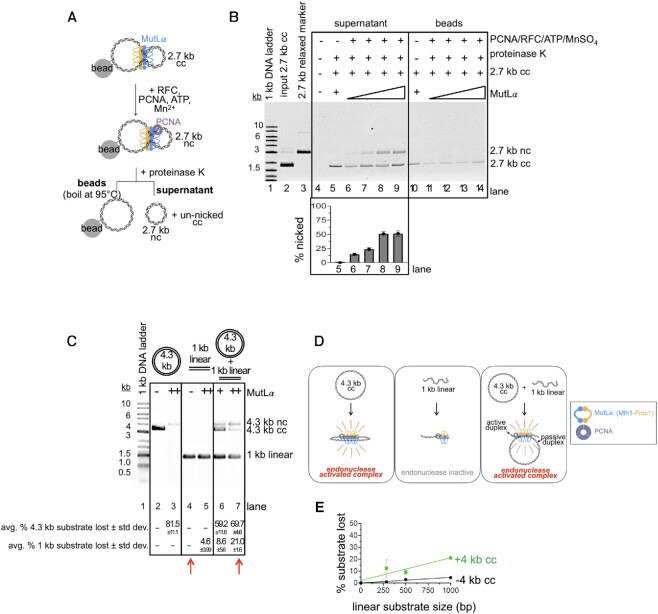
Figure 3.
DNA tethering by MutLα promotes endonuclease activity. (A) Schematic depicting addition of endonuclease activating factors to DNA tethered by MutLα. (B) Native agarose gel assaying nicked 2.7 kb DNA from supernatant and bead-bound fractions. Lane 1 contains 1 kb plus DNA ladder (NEB), Lane 2 contains DNA input for 2.7 kb (135 ng, 77 fmol) plasmids and lane 3 contains 2.7 kb relaxed circular marker. For lane 5, MutLα concentration is 4 pmol and for lanes 6–9 MutLα concentrations are 2, 3, 4 and 6 pmol respectively combined with 10 pmol PCNA, 2 pmol RFC, 2.5 mM MnSO4, and 0.25 mM ATP. Lanes 11–14 are from boiled bead samples containing same MutLα titration. After addition of the endonuclease activating components, reactions were incubated at 37°C for 60 min prior to addition of protease and separation of supernatant and bead-bound fractions. The amount of DNA that is nicked is measured as the band intensity in the nc position relative to sum of the intensity in the nc band and the cc band. (C) MutLα can be promoted to nick a 1 kb linear substrate that is not nicked in isolation, in the presence of a second, larger (4.3 kb circular) DNA substrate. The 4.3 kb substrate is commercially available pBR322 (Invitrogen) and the 1 kb substrate was generated by isolating PCR products of these sizes. For both the 1 kb and 4.3 kb substrates, the final nucleotide concentration is 20 μM. MutLα was present at either 100 nM (+) or 200 nM (++) final concentrations. Endonuclease products are analyzed by denaturing gel as described in the Materials and Methods. Endonuclease activity is quantified as a loss of signal in substrate band relative to negative controls. Data below the gel represent the average and standard deviation of 3 experiments. Red arrows indicate lanes that should be compared to observe nicking in trans activity of the 1 kb fragment. (D) Model for MutLα activity in assay in panel C. RFC was also included in the reaction to load PCNA, but is not depicted. (E) Experiments performed identical to panel C at the 200 nM MutLα titration point. Gels were quantified and plotted based as the signal lost of the smaller DNA fragment in a denaturing agarose gel both with and without the 4.3 kb DNA. Experiment was performed in triplicate and error bars represent standard deviation between experiments.

