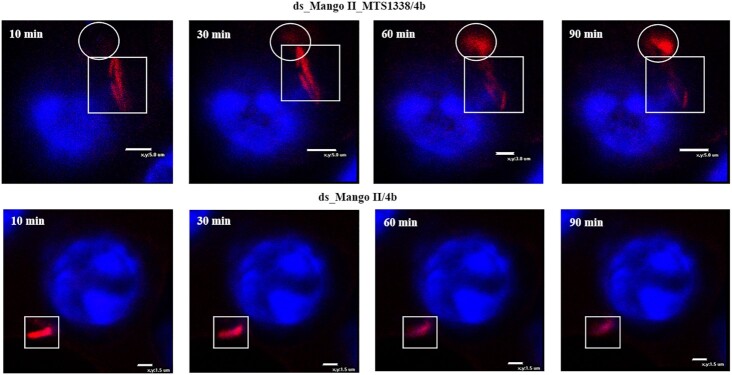
Figure 7.
Tracking of the red fluorescent signal for 1.5 h (10, 30, 60 and 90 min), using the genetically encoded modular RNA or ds_Mango II and 4b in infected RAW 264.7 macrophages (enlarged scale). Macrophage nuclei were stained with Hoechst 33258. The circles show fluorescent signal movement/occurrence, while squares highlight the area of signal disappearance.

