
Figure 6.
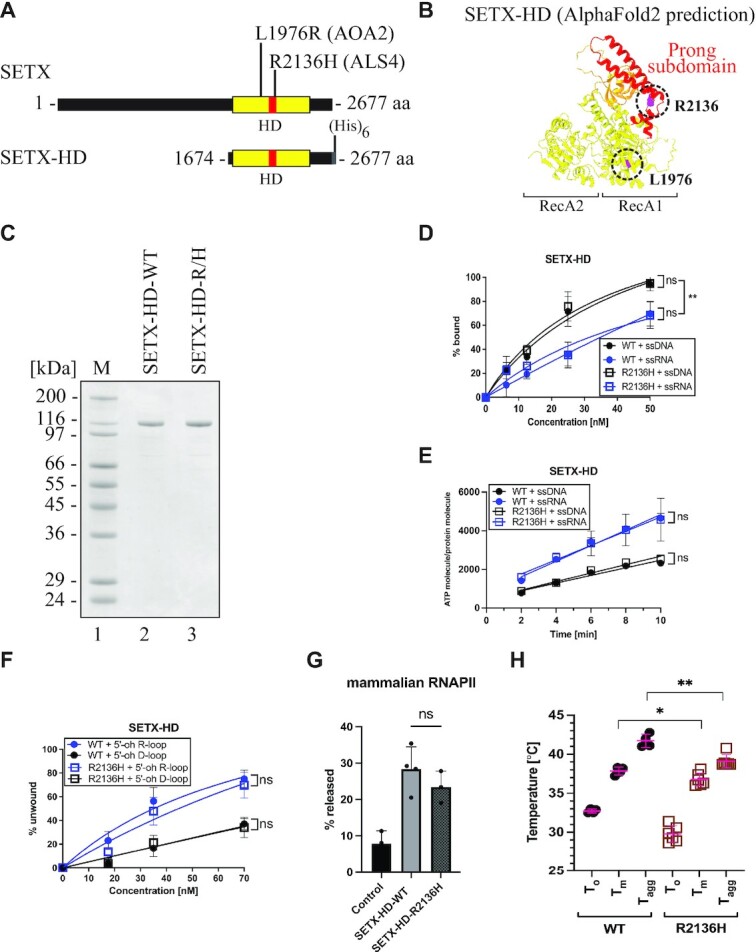
Purification and biochemical characterisation of SETX-HD variants associated with neurodegenerative diseases. (A) Schematic representation of SETX and position of the investigated mutations associated with AOA2 (the SETX-HD L1976R (L/R) variant) and ALS4 (the SETX-HD R2136H (R/H) variant). (B) Structure of the helicase domain of SETX predicted by AI-mediated modelling using AlphaFold2. RecA1 and RecA2 domains are depicted in yellow, β-barrel in orange, and the ‘prong’ subdomain in red. In purple are highlighted the positions of the amino acids mutated in AOA2 (L1976) and ALS4 (R2136). (C) SDS-PAGE gel showing the purified proteins SETX-HD-WT and SETX-HD-R/H. M: molecular weight marker. (D) SETX-HD-R/H binds nucleic acid substrates to the same extent as SETX-HD-WT. Quantification of EMSA with SETX-HD-WT and SETX-HD-R/H, respectively, in the presence of single-stranded DNA (pRMS679, in black, 61 nt) or single-stranded RNA (pRMS678, in blue, 61 nt). The data points in the graph represent the mean of several independent experiments (WT + ssDNA: n = 4; WT + ssRNA: n = 3; R/H + ssDNA: n = 3 and R/H + ssRNA: n = 4), while error bars represent the SD. The values obtained for the highest concentration were compared using a two-tailed unpaired Student′s t-test. The resulting P-values (P) are represented by ns (non-significant) P > 0.05. A scan of a representative experiment is included in Supplementary Figure S7C. (E) SETX-HD-R/H exhibits ATPase activity comparable to SETX-HD-WT. Quantification of ATP hydrolysis by SETX-HD-WT and SETX-HD-R/H in the presence of single-stranded DNA or RNA (both 44 nt) plotted as a function of time. The data points represent the mean of several independent experiments (WT/R/H + ssRNA: n = 4 and WT/R/H + ssDNA: n = 3), while error bars represent the SD. The values obtained for the highest concentration were compared using a two-tailed unpaired Student′s t-test. The resulting P-values (P) are represented by ns (non-significant) P > 0.05. A scan of a representative experiment is shown in Supplementary Figure S7D. (F) SETX-HD-R/H unwinds 5′-oh R-loop and 5′-oh D-loop structures similarly to SETX-HD-WT. Quantification of helicase assays performed in the presence of increasing concentrations of SETX-HD-WT and SETX-HD-R/H with 5′-oh R-loop (blue) or 5′-oh D-loop (black) as substrates. The data points represent the mean of 4 (for 5′-oh R-loop) or 3 (for 5′-oh D-loop) independent experiments and error bars represent the SD. The values obtained for the highest concentration were compared using a two-tailed unpaired Student′s t-test. The resulting P-values (P) are represented by ns (non-significant) P > 0.05. A scan of a representative experiment can be found in Supplementary Figure S7E. (G) SETX-HD-R/H is as efficient as SETX-HD-WT in terminating transcription in vitro. Quantification of RNA transcripts in the supernatant fraction. Values represent the mean of 3 or 4 (for SETX-HD-WT) independent experiments and error bars represent the SD. The values obtained for the mutant were compared to the WT using a two-tailed unpaired Student′s t-test. The resulting P-value (P) is indicated by ns (non-significant) P > 0.05 and ** P < 0.01. A representative scan of the experiment can be found in Supplementary Figure S7F. (H) SETX-HD-R/H variant is less thermostable than SETX-HD-WT. Quantification of the thermostability of SETX-HD-WT and SETX-HD-R/H measured by nanoDSF. Plots represent the mean of replicate measures (WT: n = 4; R/H: n = 6) indicating the temperatures corresponding to the onset of protein unfolding (To), the melting temperature (Tm), and the onset of protein aggregation (TAgg). Error bars represent the SD. The P-value (P) resulting from a two-tailed unpaired Student′s t-test is represented by * P < 0.05; ** P < 0.01. A representative thermograph can be found in Supplementary Figure S7G.