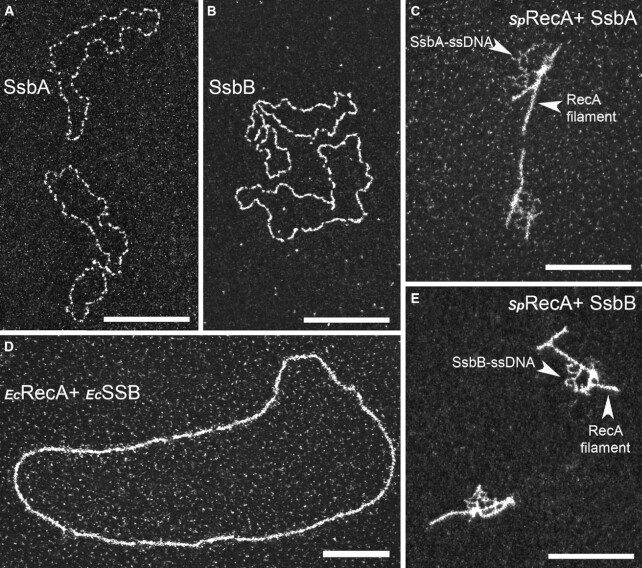
Figure 2.
TEM analysis of SpRecA and EcRecA assembly on ssDNA in presence of SpSsbA and SpSsbB, or EcSSB. Representative electron micrographs images of ΦX ssDNA (15 μM) incubated either with saturating amount (1 μM) of SsbA (A) or SsbB (B), or pre-incubated with SpRecA and, next, incubated with non-saturating amount (0,25 μM) of SsbA (C) or SsbB (E), or pre-incubated with EcRecA and, next, incubated with non-saturating amount of EcSSB (D). All scale bars represent 200 nm.

