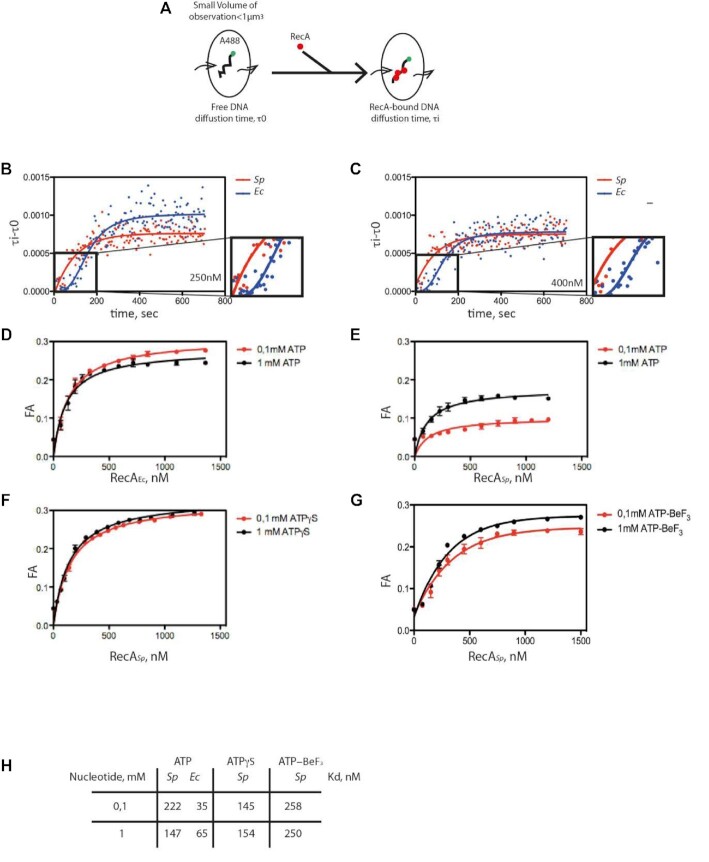
Figure 7.
FCS analysis of SpRecA and EcRecA assembly on single molecules of ssDNA. (A) Schematic of the experimental set up using FCS for the direct measurement of the change of diffusion time of fluorescently labeled (A488) ssDNA of 100 nucleotides length upon binding of SpRecA and EcRecA. (B and C) Averaged curve of three measurements of diffusion time at 250 nM of protein (B) showing a mean of half-time polymerization of 72.54 ± 11.85 s for SpRecA and 111.99 ± 18.24 s for EcRecA and at 400 nM of protein (C) showing a mean of half-time polymerization of 69 ± 6.0 s for SpRecA and 132, 35 ± 29.8 s for EcRecA. (D–H) Equilibrium binding of EcRecA (D) of SpRecA (E) of EcRecA in the presence of ATP. Fluorescence anisotropy (FA) variation with 1 mM ATP (black circles) and 0.1 mM ATP (red circles) with a Kd of 65 nM and 35 nM in presence of 1 mM and 0.1 mM ATP, respectively. The plots are the average of three experiments and the standard error of the mean (sem) is represented. In the presence of ATPγS (F); ATP-BeF3 (G); parameters table (Kd) obtained from the above measurements (H).

