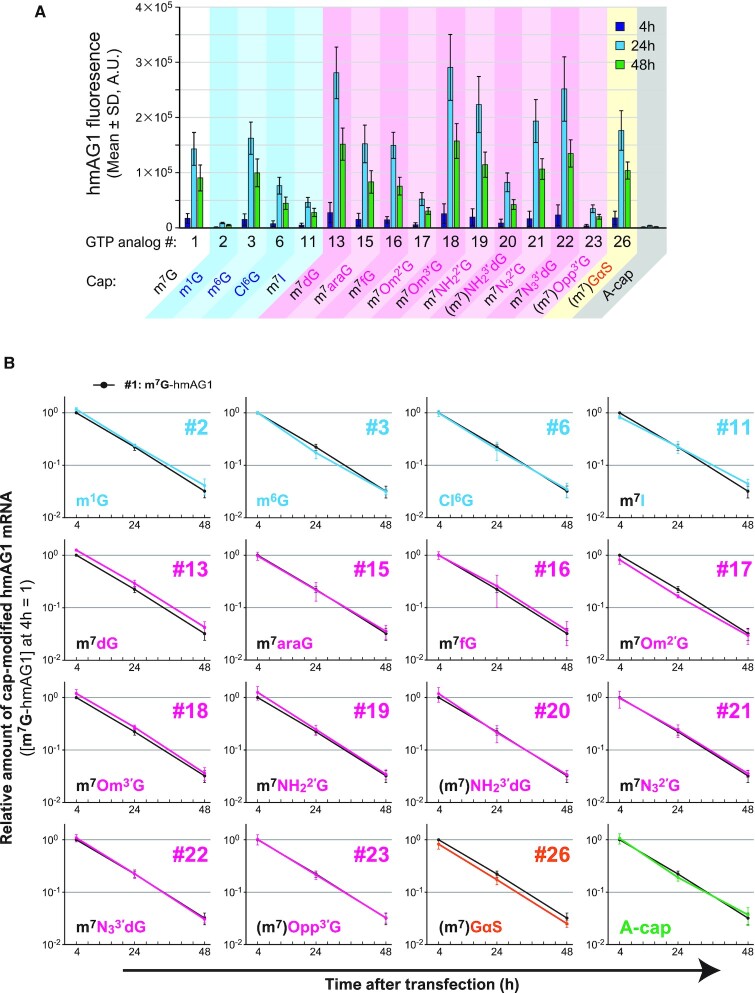
Figure 5.
Time-course changes in expressed protein level and the amount of the residual mRNA in HeLa cells. (A) The expressed hmAG1 level was analyzed with flow cytometry. The mean of fluorescent intensity at each time point is shown. (B) The relative amount of residual mRNA after transfection was quantified by real-time qPCR. The black point indicates the mRNA level of natural m7G (#1)-capped mRNA. Each value was normalized to that of m7G (#1)-capped mRNA at 4 h.

