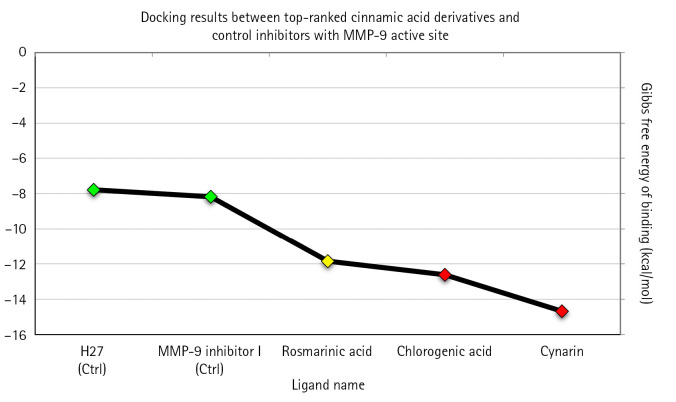
Fig. 1.
Binding affinity between this study’s top-ranked compounds, positive control inhibitors, and MMP-9 active site. The X-axis demonstrates the ligand name, and the Y-axis shows their corresponding ΔGbinding (kcal/mol). Green diamonds illustrate the control inhibitors, while the yellow and red spots show top-ranked inhibitors with Ki values at nanomolar and picomolar scales, respectively. MMP-9, matrix metalloproteinase-9; Ki, inhibition constant.

