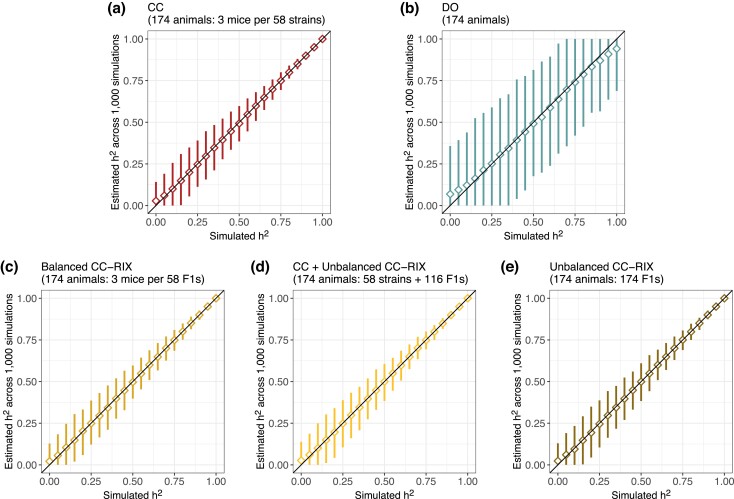
Fig. 3.
Performance of heritability estimation in data simulated for 174 mice from a) CC, b) DO, and c–e) CC-RIX populations. Diamonds represent the mean estimated heritability across 1,000 simulations from a given true heritability. Vertical line segments represent middle 95% intervals across the 1,000 simulations. Diagonal lines indicating the heritability estimate is equal to the true value (y = x) included for reference. See Supplementary Figure S3 for results from simulations of 500 mice.

