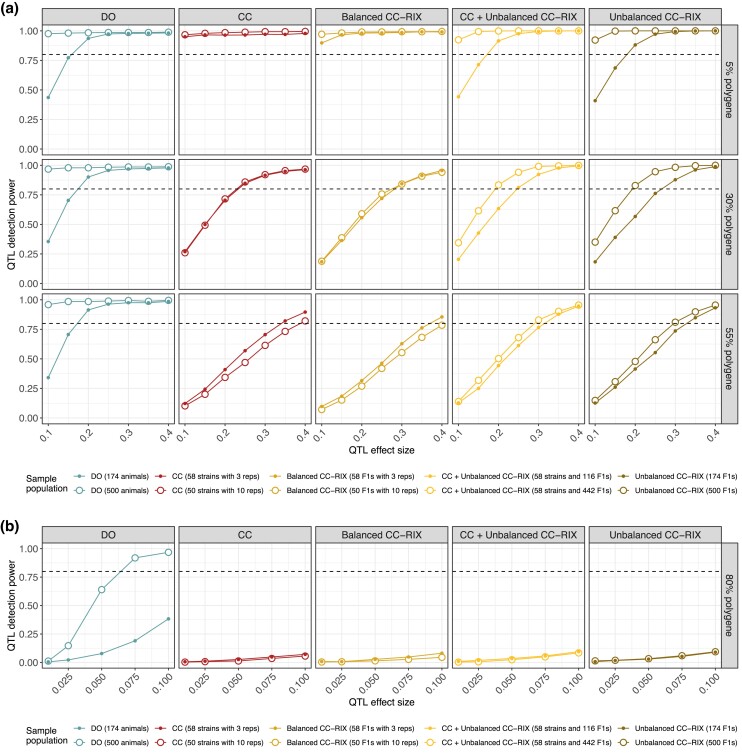
Fig. 7.
QTL mapping power based on lenient local chromosome significance (such as for detecting cis-eQTL) in data simulated for CC, CC-RIX, and DO populations. QTL power curves across populations (columns) and a) low-to-moderate polygenic background (rows) and b) a highly polygenic background. Sample populations were composed of 174 (solid points) and 500 mice (open points). Horizontal dashed lines at 80% power included for reference. For power estimates based on stringent genome-wide FWER control, see Fig. 6.

