
Figure 3:
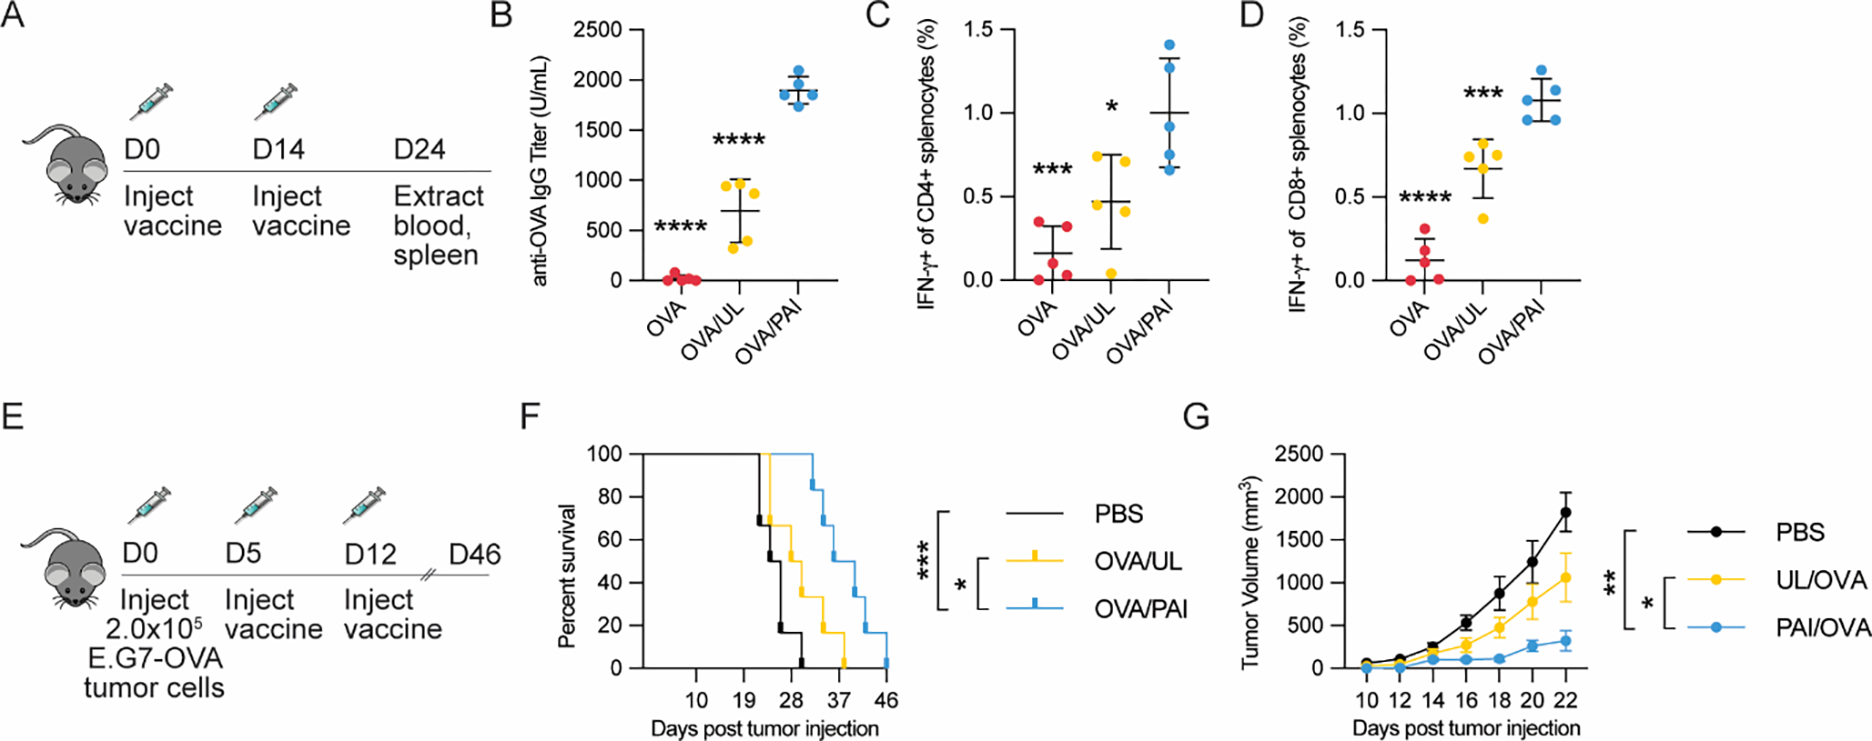
Vaccination studies of PAIs or controls formulated with OVA antigen (20 μg). (A) Study design for prophylactic vaccination model (n=5/group). (B) Serum anti-OVA IgG levels were analyzed via ELISA. (C-D) Splenocytes were analyzed for antigen-specific T-cells via intracellular cytokine staining and flow cytometry. (C) Percentage of IFN-γ secreting CD4+ splenocytes after restimulation with OVA323-339. (D) Percentage of IFN-γ secreting CD8+ splenocytes after restimulation with OVA257-264. (E) Study design for therapeutic vaccination model using a E.G7-OVA tumor (n=6/group). Mice were implanted with 2.0 × 10⁵ E.G7-OVA cells in the flank and vaccinated with the indicated formulations 5 and 12 d after implantation. (F) Kaplan-Maier survival analysis of mice treated with various formulations. (G) Growth curves of tumors until the first mouse died (day 22). For all assays, *p < 0.05, **p < 0.01, ***p < 0.001, ****p < 0.0001. Statistical analyses were performed using one-way ANOVA with Dunnett’s multiple comparisons test in B-D and G and by using log-rank test with Bonferroni-correction in F.