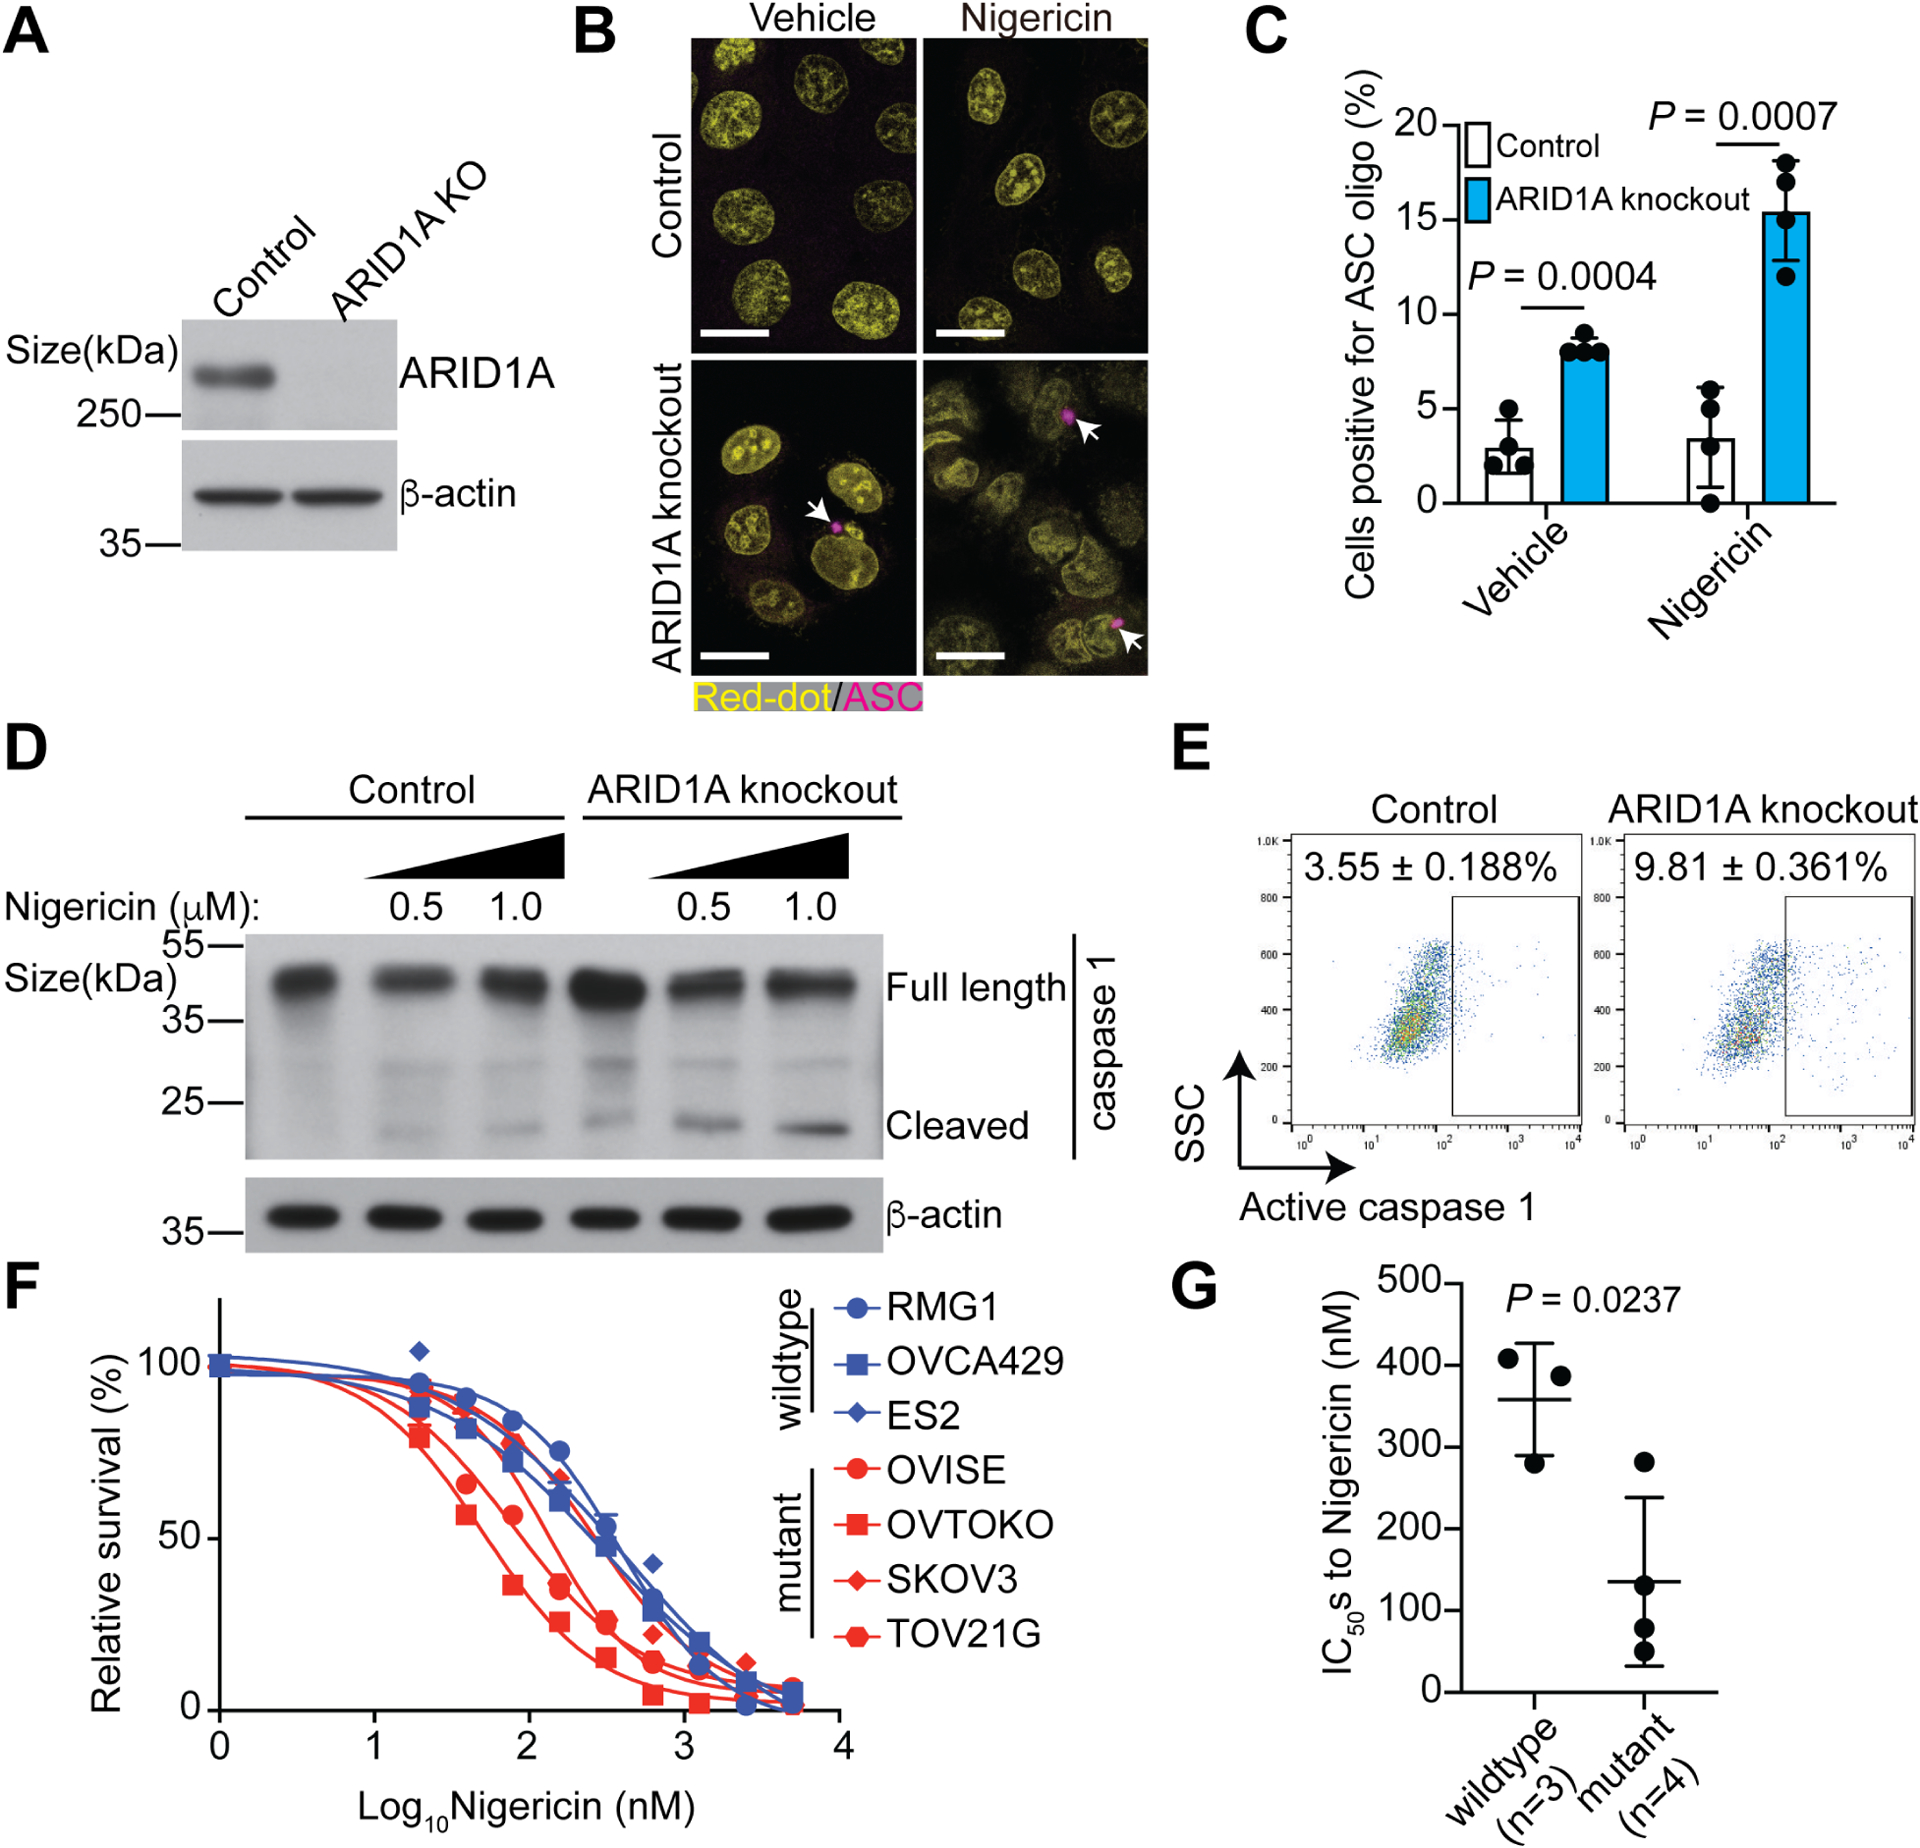
Figure 1. ARID1A inactivation sensitizes cells to pyroptosis induction.

A, Validation of ARID1A knockout in ARID1A wildtype OVCA429 OCCC cells by immunoblot.
B, Representative immunofluorescence images of ASC-mCerulean staining in control and ARID1A knockout OVCA429 cells with or without Nigericin treatment (0.5 μM). Arrows point to examples of ASC oligo, a marker of inflammasome. Nuclei were visualized by RedDot staining. Scale bar = 20 μm.
C, Quantification of ASC positive cells in the indicated OVCA429 cells.
D, Expression of caspase 1 in the indicated OVCA429 cells treated with or without Nigericin was determined by immunoblot.
E. Activity of caspase 1 in the indicated OVCA429 cells treated with Nigericin (0.5 μM) was determined by flow cytometry. Percentages of caspase 1 positive cells were indicated based on three biological repeats.
F, Dose responsive curves of the indicated ARID1A wildtype or mutant OCCC cell lines to Nigericin were determined by the AlamarBlue assay.
G, IC50s of Nigericin are significantly higher in ARID1A wildtype (RMG1, OVCA429 and ES2) than mutant (OVISE, OVTOKO, SKOV3 and TOV21G) cell lines.
Error bars represent mean with SEM in C and G. P values were calculated using two-tailed Student t-test in C and G.
See also Figure S1.
