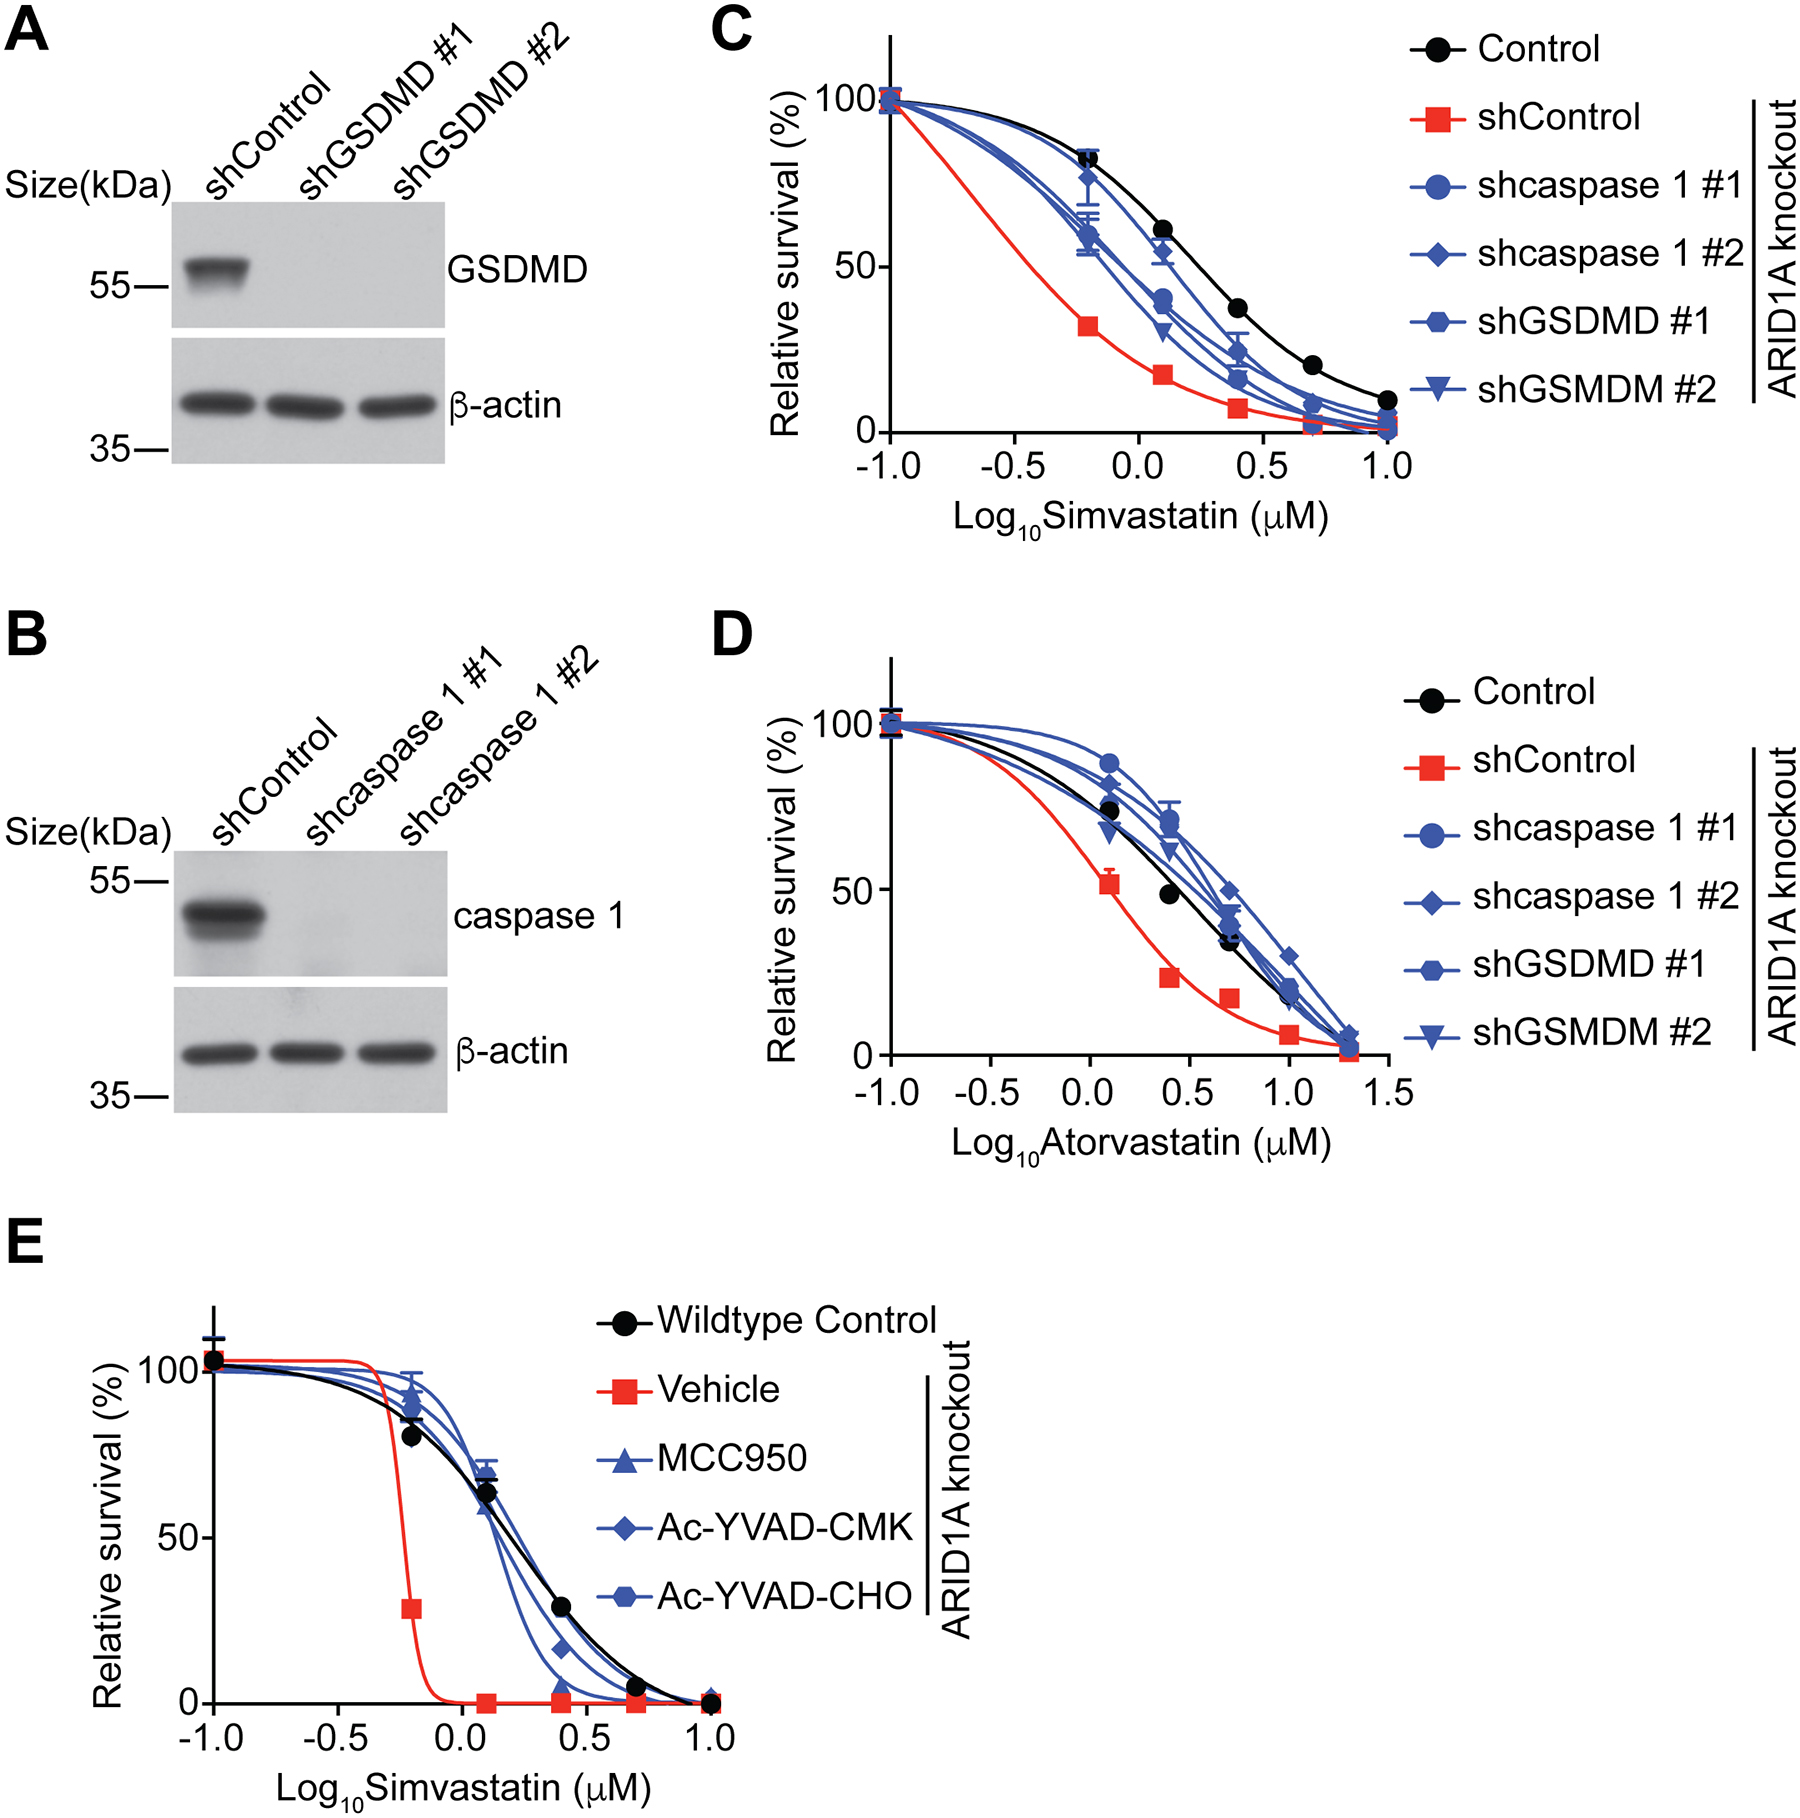
Figure 5. Statin-induced growth inhibition is pyroptosis dependent.

A, Expression of GSDMD in the indicated OVCA429 cells was determined by immunoblot.
B, Expression of caspase 1 in the indicated OVCA429 cells was determined by immunoblot.
C, Dose response curves of the indicated OVCA429 cells to simvastatin were determined by colony formation assay. n=4 independent experiments.
D, Dose response curves of the indicated OVCA429 cells to atorvastatin were determined by colony formation assay. n=4 independent experiments.
E, Dose response curves of the indicated OVCA429 cells treated with or without MCC950 (1 μM), Ac-YVAD-CMK (20 μM) and Ac-YVAD-CHO (20 μM) to simvastatin was determined by colony formation assay. n=4 independent experiments.
Error bars represent mean with SEM.
