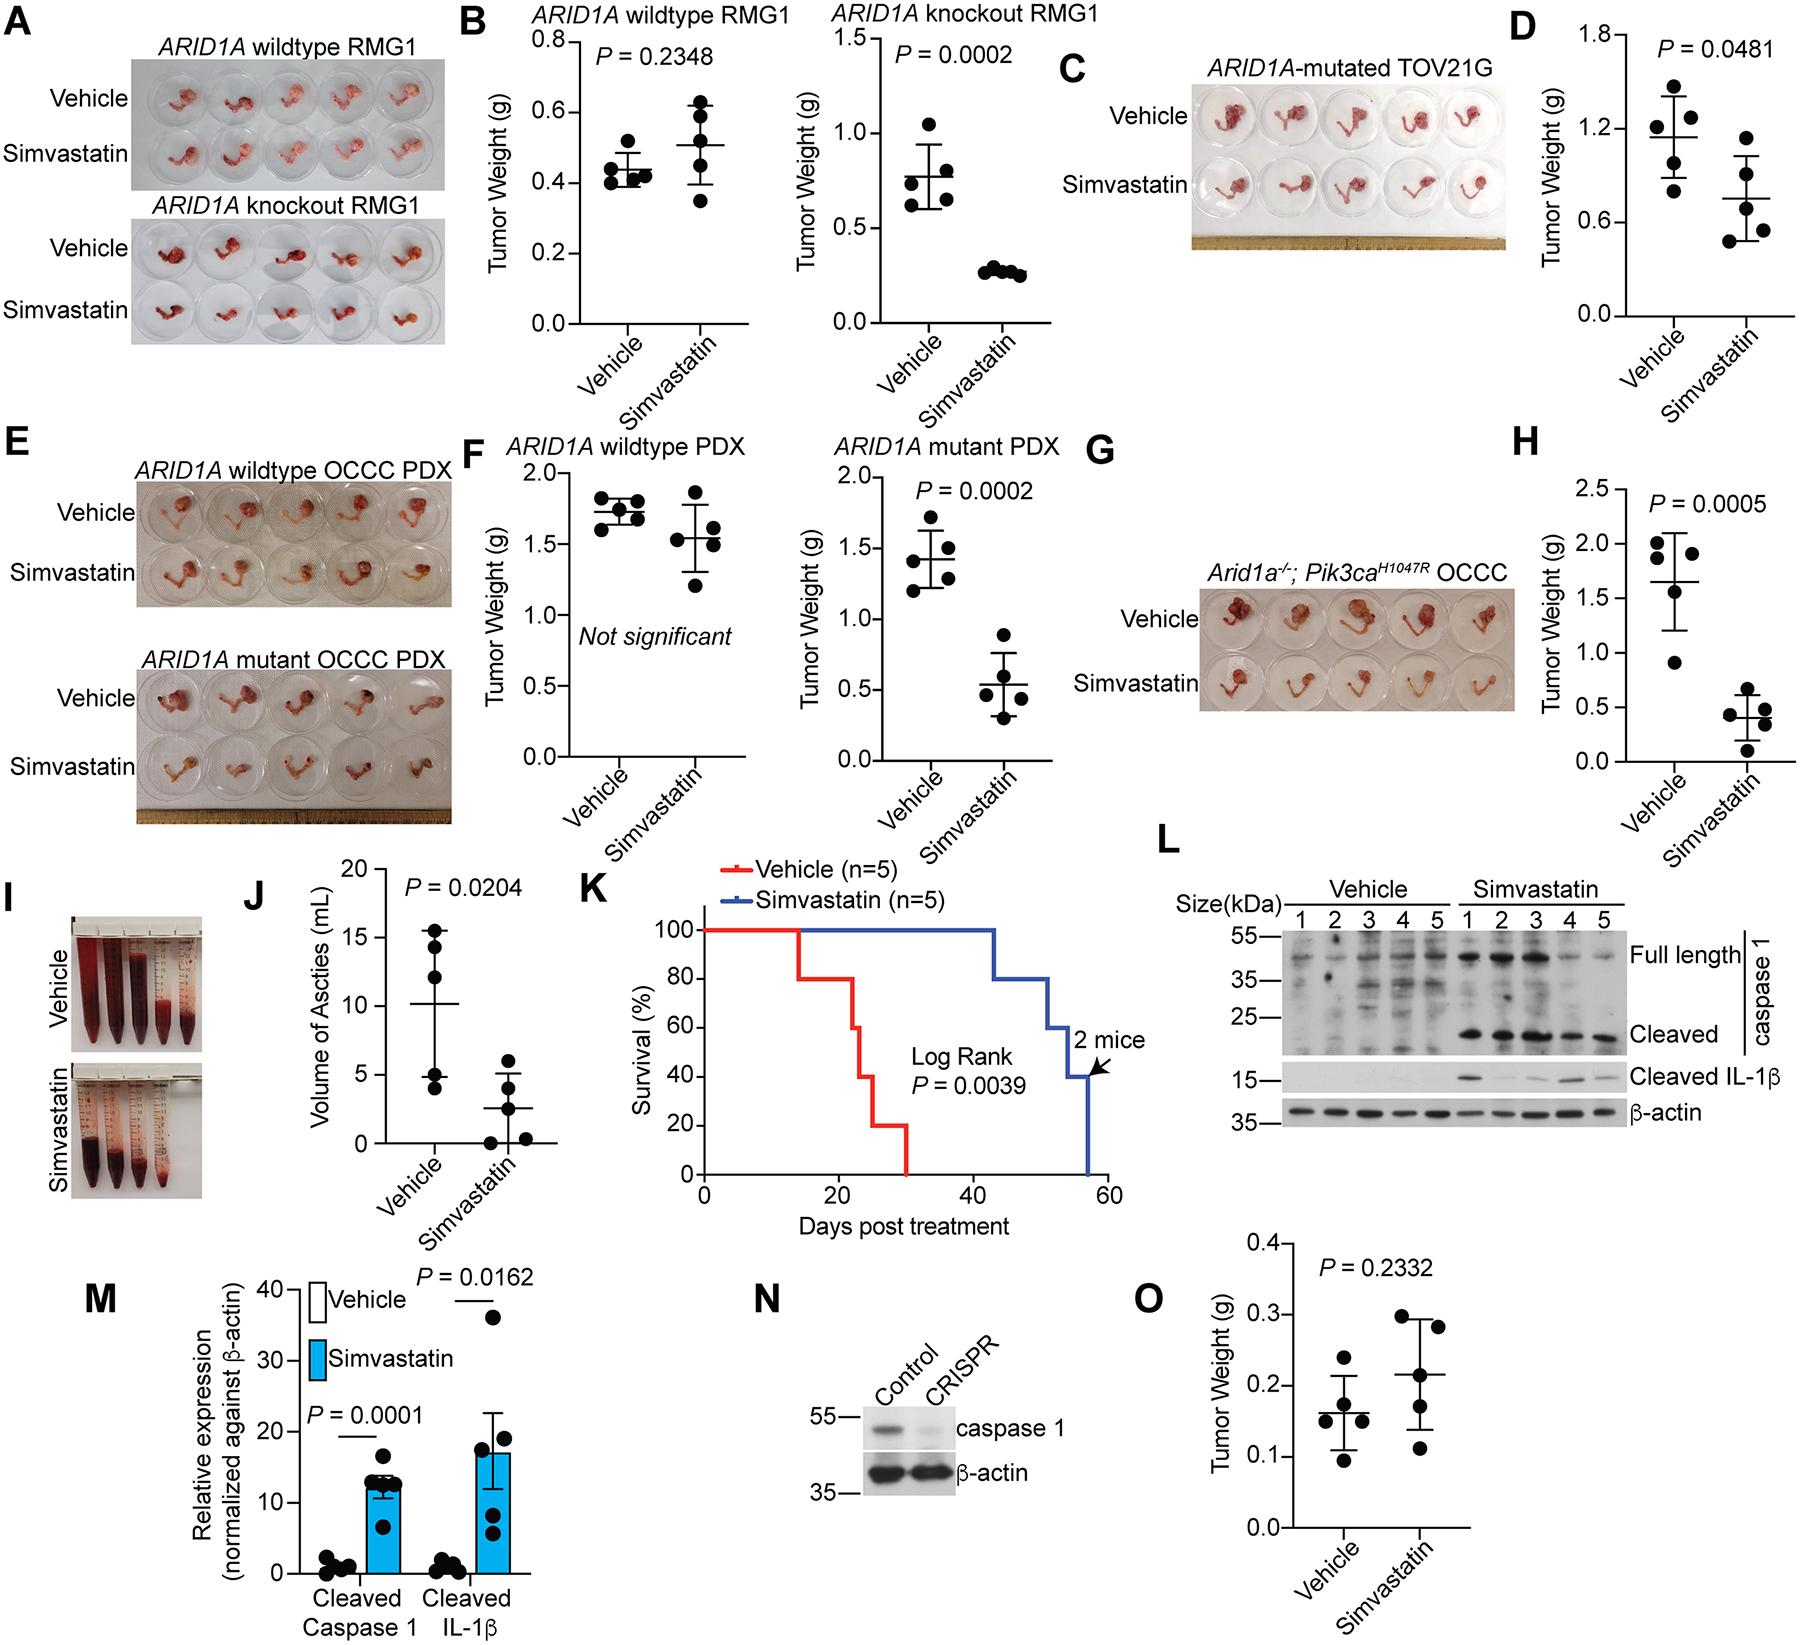
Figure 7. Simvastatin suppresses the growth of ARID1A inactivated OCCCs in vivo.

A-B, Orthotopic xenografts formed by control or ARID1A knockout RMG1 cells were treated with vehicle or simvastatin (n=5 mice/group). Shown are images of reproductive tracks with tumors from the indicated groups at the end of treatment (A). Tumor weights were measured as surrogates for tumor burden (B).
C-D, Same as A-B, but for orthoptic xenografts formed by ARID1A-mutated TOV21G cells.
E-F, Mice bearing wildtype or mutant ARID1A OCCC PDXs were treated with vehicle or simvastatin (n=5 mice/group). Shown are images of reproductive tracks with tumors from the indicated groups at the end of treatment (E). Tumor weights were measured as surrogates for tumor burden (F).
G-M, Mice bearing Arid1a−/−;Pik3caH1047R OCCCs were randomized into two indicated treatment groups (n=5 mice/group). Images of reproductive tracts with tumors from the indicated groups are showed (G). Tumor weight were measured as surrogate for tumor burden (H). Ascites produced in the indicated treatment groups (I) were quantified (J) at the end of treatment. After completing treatment, mice were followed for survival, and the Kaplan-Meier survival curves for each of the indicated groups are shown (K). The arrow indicates the time point when two mice met the criteria for euthanization. Expression of caspase 1 and IL-1β in tumors harvested at the end of experiments was determined by immunoblot (L), which was quantified by NIH ImageJ software (M).
N-O, Expression of caspase 1 and a loading control β-actin in Arid1a−/−;Pik3caH1047R tumors developed from mice injected with a lentivirus encoding both Cre-recombinase and a sgRNA to mouse Casp1 (N). Tumors developed from mice injected with only Cre-recombinase were used as a control for caspase 1 expression. The tumors developed in this model were randomized and treated with vehicle control or simvastatin the same as in (H) and tumor weight was measured as surrogate for tumor burden (O) (n=5 mice/group).
Error bars represent mean with SEM in B, D, F, H, J, M and O. P values were calculated using two-tailed Student t-test in B, D, F, H, J, M and O.
