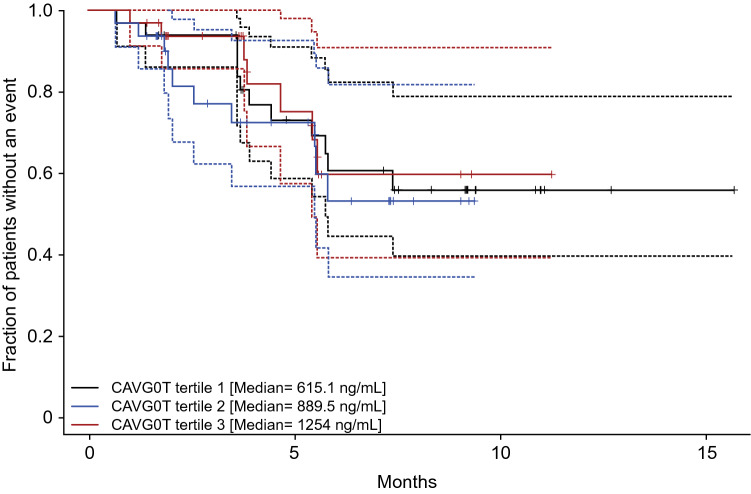
Fig. 3.
Kaplan–Meier plot for progression-free survival by average exposure tertile. Data derived from 98 patients with at least one measurable cabozantinib concentration, a valid baseline tumor assessment, and at least one evaluable post-baseline tumor assessment in COSMIC-311. Dashed lines represent 95% confidence intervals for each exposure tertile. CAVG0T predicted average cabozantinib concentration from time zero to the event or censoring time, PFS progression-free survival

