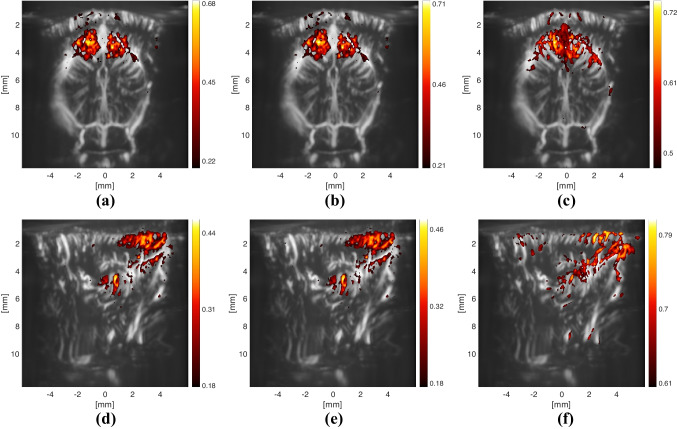
Fig. 9.
Correlation images obtained by correlating the pixel time-series with a different signal at each plot. All of the correlation images are thresholded such that only the pixels with a significant correlation value (with a z-score ) are displayed. The colorbars denote the value of the Pearson correlation coefficient, and they are scaled up to the maximum value achieved with the corresponding approaches. Note that the approach used in (c) and (f) leads to a similar result as using SC and LGN respectively as a seed region, since the result of the convolution matches well to the average ROI responses, as shown in Fig. 8g

