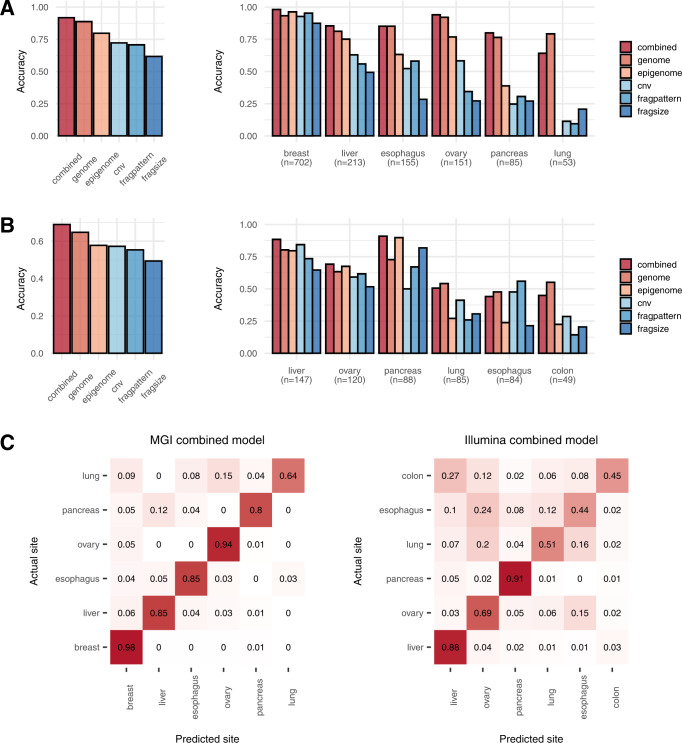
Fig. 3. Performance of tissue-of-origin localization.
A Average accuracy (left) and accuracy (right) on each cancer type for different models on the MGI training cohort. B Average accuracy (left) and accuracy (right) on each cancer type for different models on the Illumina training cohort. C Confusion matrix for localization using the combined model on the MGI cohort (left) and Illumina cohort (right). The y-axis represents the actual site, and the x-axis represents the predicted site. The numbers in the cells of the matrix represent the proportion of samples of each cancer type localized to respective tumor sites. A–C Our genome, epigenome, and combined models were compared with predictions based on fragmentation patterns9 (fragpattern), fragment size profiles8 (fragsize), and copy number variations3 (cnv). Source data are provided as a Source Data file.

