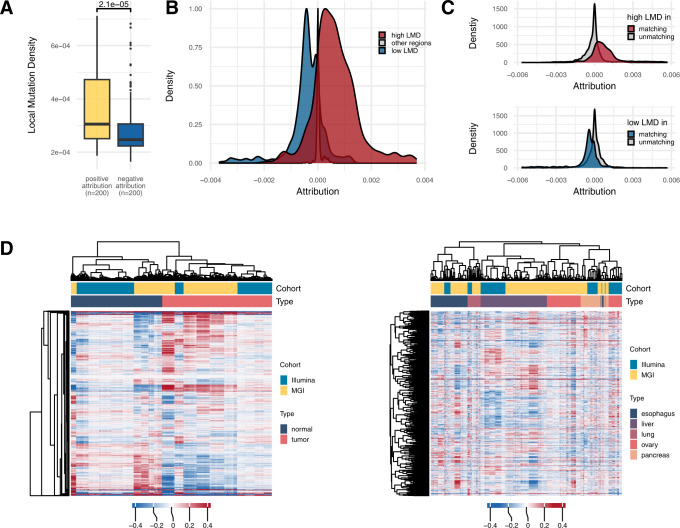
Fig. 5. Interpretation of the genome model.
A LMD values obtained from tumor tissues in the LVD regions with positive or negative attribution for cancer samples in the genome model for cancer detection on the MGI training cohort. P values from the Wilcoxon test are indicated (two-sided). Each box indicates IQR and median, whiskers indicates 1.5× IQR, black dots indicates outlier. B Distribution of the attribution values assigned by the cancer localization genome model of the MGI training cohort to high or low LMD regions in comparison to other regions of the PCAWG cancer type matching the given prediction label. C Comparison of the attribution values assigned by the cancer localization genome model to high (upper) or low (lower) LMD regions of the PCAWG cancer types matching versus unmatching with the given prediction label. D Clustered heatmaps of normalized attribution values in the genome model for (left) cancer detection and (right) cancer localization across normal samples and patient samples. The cancer types commonly present in the MGI training cohort and Illumina training cohort were included. Only the samples with a test prediction score above the threshold were included. The attribution values of all genome model features were normalized as the z score. Source data are provided as a Source Data file.

