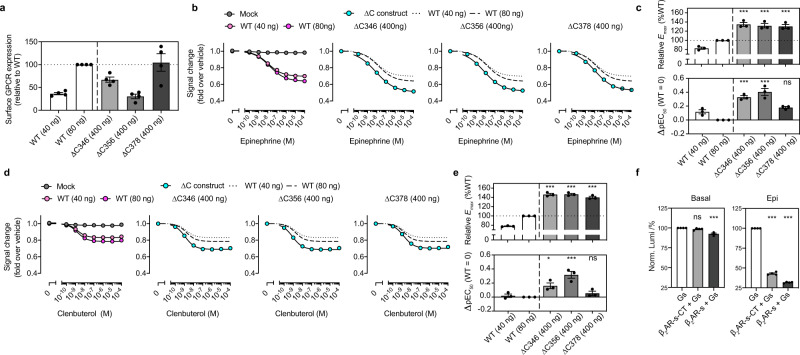
Fig. 1. The β2AR CT autoinhibits agonist-stimulated receptor activation.
a Cell surface expression measured by the flow cytometry analysis. Note that amount of plasmid transfection of WT β2AR was titrated down to 40 ng and 80 ng to adjust the expression levels equivalent to the ∆CT β2AR. Data are mean±s.e.m. of 4 independent experiments. b Concentration-response curves of epinephrine-induced Gs heterotrimer dissociation in cells. The β2AR-mediated Gs dissociation was measured by the NanoBiT-G-protein dissociation assay, stimulated by full agonist epinephrine in WT and the three ∆CT receptors. Data are mean±s.e.m. of 3 independent experiments. Νote that in many data points error bars are smaller than the size of symbols and thus are not visible. c The relative Emax and ∆pEC50 parameters of the Gs dissociation responses stimulated by epinephrine in (b). d Partial agonist clenbuterol stimulated Gs dissociation in WT and three ∆CT receptors. Data are mean±s.e.m. of 3 independent experiments. e The relative Emax and ∆pEC50 parameters of the Gs dissociation responses stimulated by clenbuterol in (d). f Removal of the β2AR CT, by pretreating the β2AR-s-CT with/without the SrtA, enhances the GTP turnover in the apo receptor and epinephrine-occupied receptor. Bars and error bars represent the mean±s.e.m. of 4 independent experiments. Statistical significances between ∆CT and expression-matched WT (∆C346 vs 80 ng; ∆C356 vs 80 ng; ∆C378 vs 40 ng) in c and e were performed by one-way ANOVA with the Sidak’s multiple comparison test. Statistical significances between Gs and the receptor-Gs mixture in f were performed by one-way ANOVA with Dunnett’s multiple comparison test. ***P < 0.001; ns, P > 0.05.

