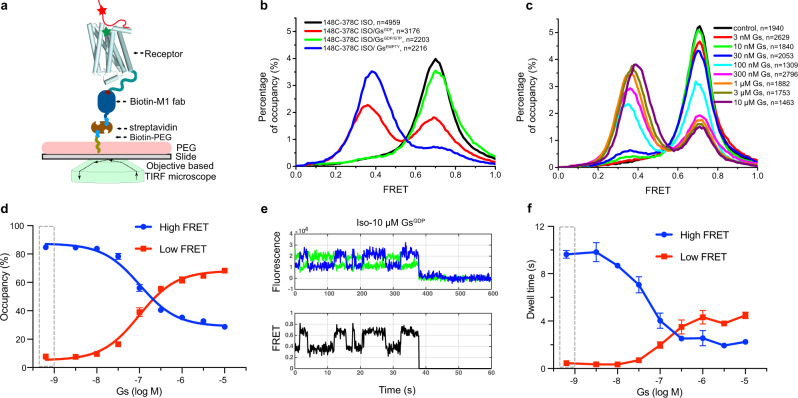
Fig. 2. The β2AR CT competes with Gs for binding to the receptor core.
a A schematic model of smFRET experiments on an objective-based TIRF microscope. The receptor core domain is shown as cylindrical helices, unstructured CT as a solid red line, and representative donor and acceptor fluorophores as red and green stars, respectively. b Representative FRET histograms of Isoproterenol occupied β2AR (148C-378C) alone, apyrase pretreated Iso-β2AR-GsEMPTY ternary complex, Iso-β2AR-Gs ternary complex with GDP or with a mixture of 30 μM GDP and 300 μM GTP. c Representative FRET histograms of the 148C-378C in the presence of different concentrations of GsGDP with 200 μM isoproterenol. The control sample has isoproterenol alone (black), and the remaining samples include increasing concentrations of GsGDP from 3 nM to 10 μM. d The dose-dependent effect of GsGDP on the occupancy of high- and low-FRET populations. The cumulative FRET histogram versus GsGDP concentration in c was fitted with a double gaussian model, and the dot and error bar represent mean±s.e.m. of 3 independent experiments. The dashed rectangular box indicates the control condition without Gs. e A representative single-molecule trace of the dynamic ternary complex in the presence of 10 μM GsGDP and saturating isoproterenol. Donor and acceptor fluorescence intensities collected at 100 ms/frame are shown as green and blue lines, respectively. FRET efficiency is shown as a black line. The sudden fluorescent drop at ~38 s of this trace represents the photobleaching of the donor fluorophore. The smFRET trace reveals transitions between low-FRET and high-FRET states (see also Supplementary Fig. 5h, i). f The formation of agonist-β2AR-Gs ternary complex increases the low-FRET dwell time while decreasing the high-FRET dwell time. The dashed rectangular box indicates the control condition without GsGDP. The high-FRET dwell time at high GsGDP concentration plateaus at about 2 s. Bars and error bars represent the mean±s.e.m. of 3 independent experiments.

