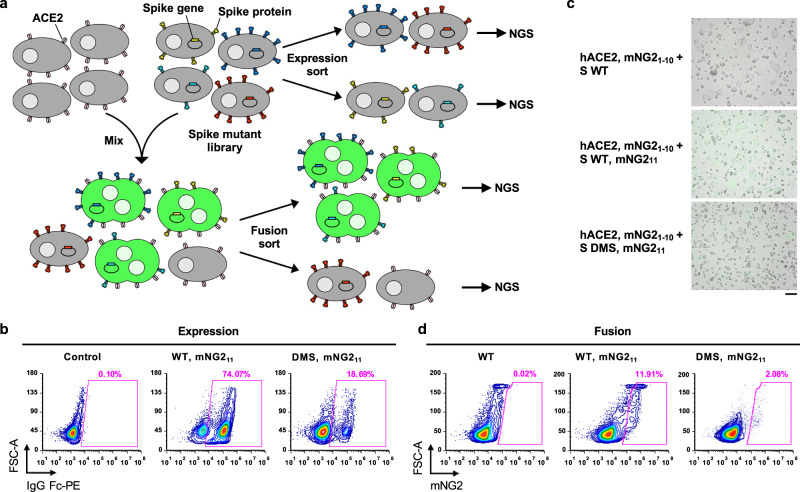
Fig. 1. Measuring protein expression and fusogenicity of SARS-CoV-2 S mutations using deep mutational scanning.
a Schematic of high-throughput expression and fusion assays for S mutants. ACE2-expressing and spike-expressing cells also express mNG21-10 and mNG211, respectively. Four-way and two-way sorting were performed for expression and fusion sort, respectively. Fig. S11c, d show gating strategies for sorting. Next-generation sequencing (NGS) was performed on an amplicon that spanned amino acids 883–1034 of S. b Flow cytometry analysis of S protein expression in HEK293T landing pad cells that encoded WT S or the DMS library. Primary antibody used was CC12.3, an RBD antibody44. c Fluorescent micrographs of co-culturing S-expression cells with hACE2-expressing cells. Micrographs are representative of n = 3 independent biological experiments. Scale bar: 100 μm. d Flow cytometry analysis of fusion activity of co-culturing hACE2-expressing cells with HEK293T landing pad cells that encoded WT S or the DMS library. Components of split mNG2 are indicated where present. Fig. S11b shows gating strategy for flow cytometry analysis of fusion.

