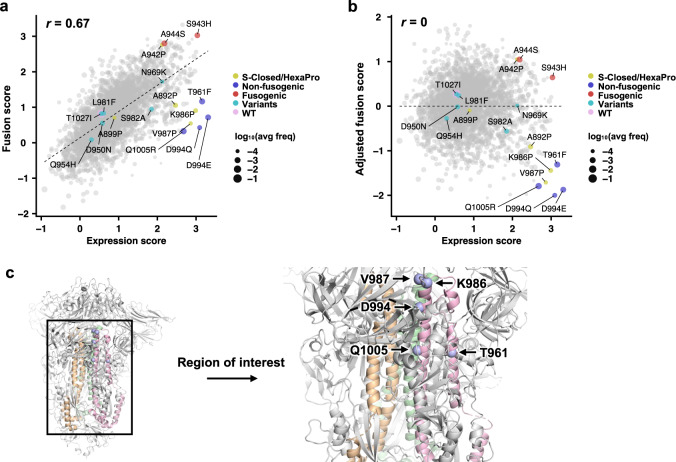
Fig. 2. Expression and fusion scores of individual mutations in the DMS library.
a Plot of fusion score against expression score for each mutant is shown. WT is indicated in pink. Mutations used in S-Closed25 and/or HexaPro24 are in yellow. Representative fusion-incompetent mutations identified in this study are in purple (non-fusogenic). Representative mutations that enhance S fusogenicity are in red (fusogenic). Mutations found in major SARS-CoV-2 variants (Supplementary Data 1) are in teal (variants). Each data point represents one mutation in the DMS library. Individual data points are sized according to average frequency of the corresponding mutations. Pearson correlation coefficient, r, is shown. b Plot of adjusted fusion score against expression score for each mutant is shown. Pearson correlation coefficient, r, is shown. c Locations of fusion-incompetent mutations are indicated by light blue spheres. Regions that are mutated in the DMS library are colored wheat, green and pink for each monomer. Other regions on the S are colored in grey. Data are from Supplementary Data 1.

