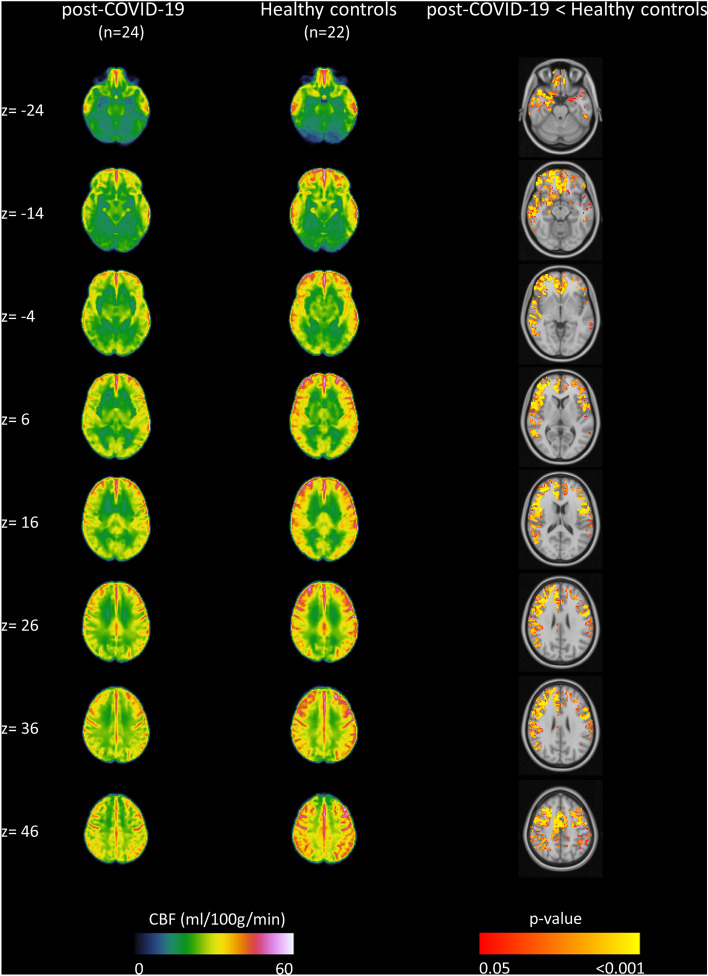
Figure 1.
Result of group analysis of MRI-ASL data. The group averaged cerebral blood flow (CBF) maps (ml/100 g/min) calculated for the post-COVID-19 group (left column) and healthy subjects (middle column). Right column depicts regions that show significant hypoperfusion in post-COVID-19 patients compared to healthy controls (non-parametric permutation test, p < 0.05, FWE-corrected with TFCE). No regions with a significantly higher perfusion in post-COVID-19 patients compared to healthy controls were detected. Images are reported in the 2-mm MNI152 standard space and in radiological convention.

