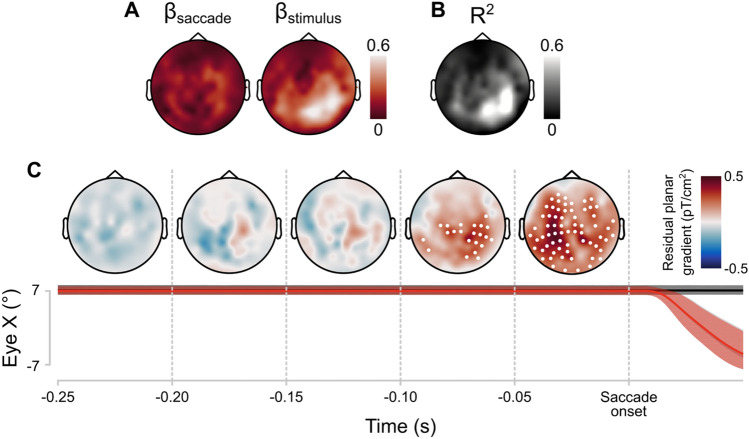
Figure 3.
Results of linear modelling of event-related fields in the Saccade + stimulus condition as a weighted linear combination of the Saccade-only and Stimulus-only conditions. (A) Topographic heatmap of estimated parameters for the Saccade-only condition (βsaccade) and the Stimulus-only (βstimulus). (B) Topographic heatmap of the proportion variance explained (R2) by the linear model. (C) Topographic heatmaps of the residual planar gradients of the linear models. Values represent group averages. Deviations from 0 were assessed with one-sample t-tests, cluster-based corrected for multiple comparisons in time and space (α = 0.05, two-tailed). Sensors with a significant deviation from 0 for at least 12.5 ms are highlighted with a white point. The average horizontal gaze position in the three conditions over time is plotted below the heatmaps. Black = Stimulus-only, grey = saccade-only, red = Saccade + stimulus (latter two overlap). Lines represent median gaze position over all trials. Shaded area is the 95% interval across all trials. Heatmap created using Fieldtrip http://www.fieldtriptoolbox.org/ and Matlab 2019b (https://uk.mathworks.com).

