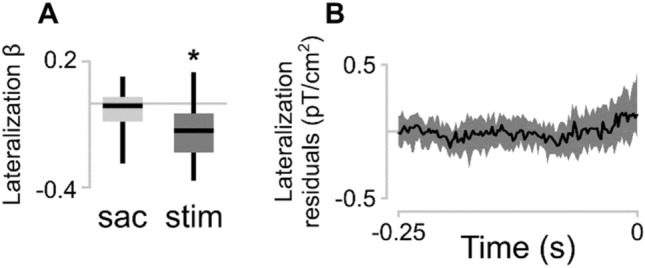
Figure 4.

(A) Lateralization of the beta coefficients. The median beta coefficient of right lateralized sensors was subtracted from the median beta coefficient of the left lateralized sensors. Boxplots represent the median and dispersion across participants. Asterisk indicates that the mean significantly deviates from zero (p < 0.001). (B) Lateralization of residual planar gradients: residuals from sensors on the left side of the helmet minus the residuals from sensors on the right side. Line represents the median; shaded area represents the interquartile range across participants.
