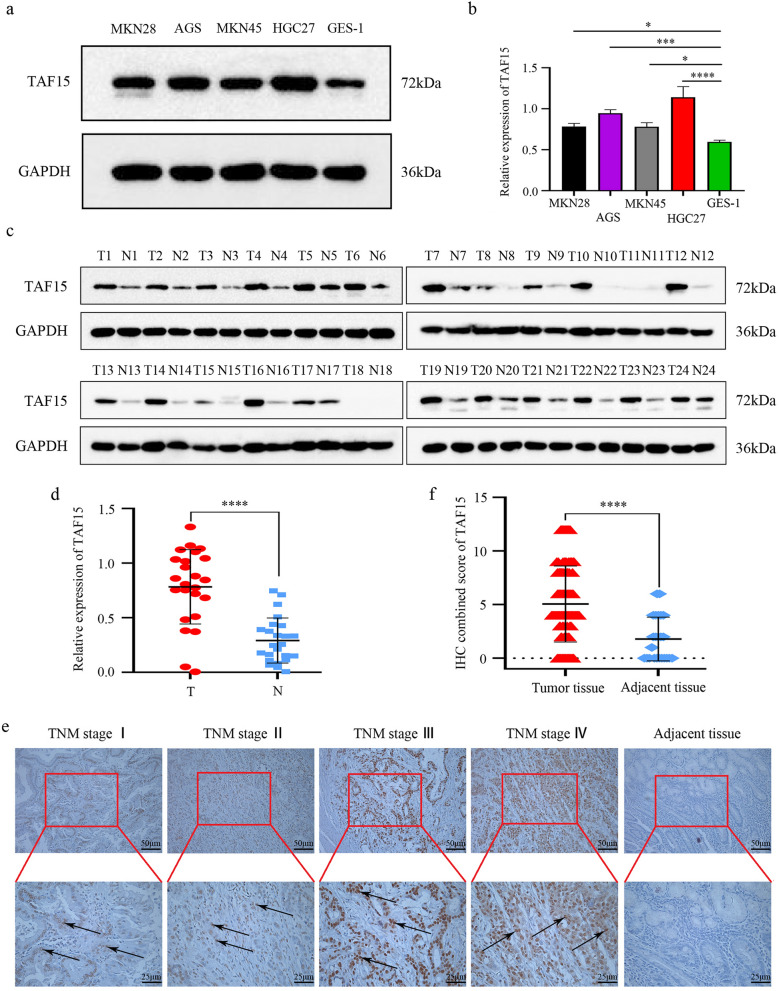
Figure 3.
The protein expression of TAF15 is upregulated in GC. (a,b) Western blot analysis for the expression of TAF15 in GC cell lines (MKN28, AGS, MKN45, HGC27) and GES-1 (Human Gastric mucosal Epithelial Cell). p values were calculated by One-way ANOVA. The experiment was repeated three times. (c,d) Western blot analysis for the expression of TAF15 in 24 GC tissues (T) and matched adjacent normal tissues (N). p values were calculated by student-t test. Three replicate experiments were performed. (e) Immunohistochemistry analysis for the expression of TAF15 in 131 GC samples and 24 adjacent normal samples. Representative images are shown. TFA15 staining was mostly detected in cell nucleus, and TFA15 was highly expressed in GC tissues. (f) The combined staining score of TAF15 in tumor tissues comparing with adjacent normal tissues. p values were calculated by student-t test. *p < 0.05, ***p < 0.001, ****p < 0.0001.

