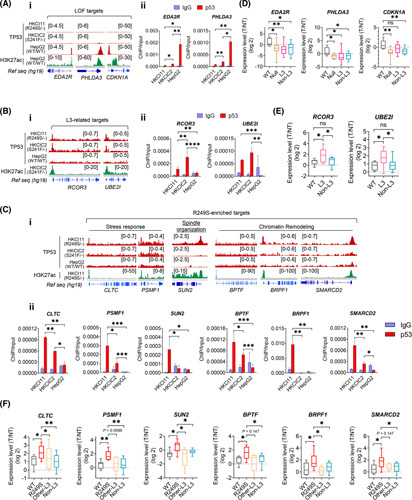
FIGURE 2.

Verification of loss‐of‐function (LOF), Loop L3, and R249S‐enriched targets. (A) Chromatin immunoprecipitation sequencing (ChIP‐seq) signals for (i) LOF targets EDA2R, PHLDA3, and CDKN1A; (ii) chromatin immunoprecipitation–quantitative polymerase chain reaction (ChIP‐qPCR) validations of EDA2R and PHLDA3 in HKCI‐11 (R249S), HKCIC2 (S241F), and HepG2 (wild‐type; WT) (*p < 0.05, **p < 0.01). (B) ChIP‐seq signals for (i) L3‐related targets RCOR3 and UBE2I in HKCI‐11 (R249S), HKCIC2 (S241F), and HepG2 (WT); (ii) ChIP‐qPCR validations (**p < 0.01, ***p < 0.001, ****p < 0.0001). (C) ChIP‐seq signals for (i) R249S‐enriched targets CLTC, PSMF1, SUN2, BPTF, PSMF1, BRPF1, and SMARCD2 in HKCI‐11 (R249S), HKCIC2 (S241F), and HepG2 (WT); (ii) and ChIP‐qPCR validations (*p < 0.05, **p < 0.01, ***p < 0.001). (D) Expression of LOF targets in a cohort of patients with hepatocellular carcinoma (HCC) with various TP53 genotype statuses (*p < 0.05, **p < 0.01). Sample size: WT (n = 7), Null (n = 8), L3 (n = 14), Non‐L3 (n = 20). (E) Expression of L3‐related targets in a cohort of patients with HCC with various TP53 genotype statuses (*p < 0.05). Sample size: WT (n = 7), L3 (n = 14), Non‐L3 (n = 20). (F) Expression of R249S‐dominant targets in a cohort of patients with HCC with various TP53 genotype statuses (*p < 0.05, **p < 0.01). Sample size: WT (n = 7), R249S (n = 9), Other‐L3 (n = 5), Non‐L3 (n = 20). Data were plotted as mean ± SEM from three independent experiments in (Aii), (Bii), and (Cii). Box plots in (D)–(F) are presented as 10th to 90th percentiles. H3K27ac, H3K27 acetylation; IgG, immunoglobulin G; ns, not significant; Ref seq, reference sequence; T/NT, tumor/non‐tumor.
