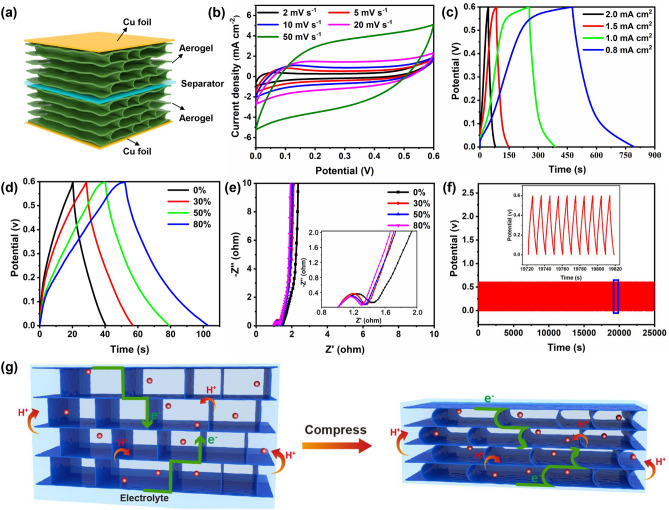
Fig. 5.
a Schematic illustration of the assembled compressible supercapacitor. b CV curves of compressible supercapacitor at scan rates of 2–50 mV s−1. c GCD curves at different areal current densities. d GCD curves and e Nyquist plots of compressible supercapacitor under various strains from 0 to 80%. f Cycling stability of solid-state compressible supercapacitors over 10,000 cycles under 30% strain. g The process illustration of ions and electrons transport in electrodes before and after compression

