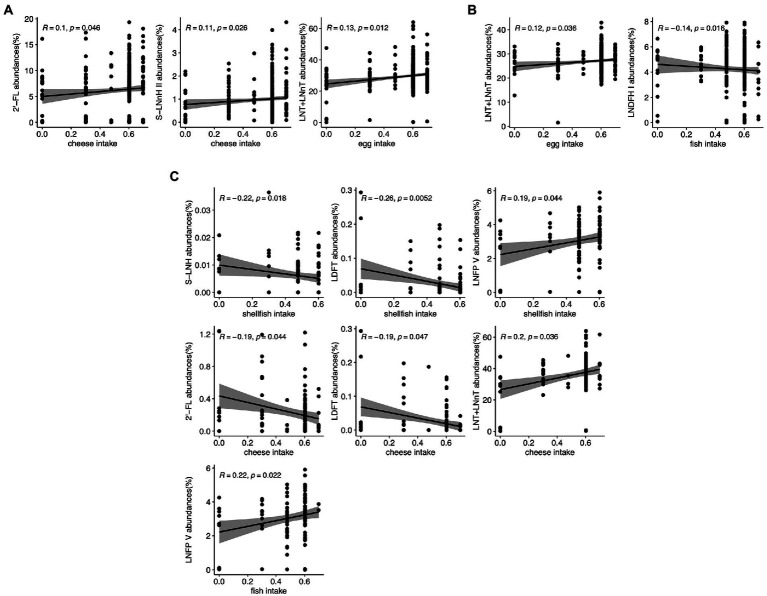
Figure 4.
Correlation between maternal food intake and individual HMO relative abundance in the STRONG Kids 2 cohort in all participants (A), Secretors (B), and Non-secretors (C). R value reflects the strength of Spearman correlation. 2′-FL, 2′-fucosyllactose; LNnT, lacto-N-neotetraose; LNT, lacto-N-tetrose; LDFT, lactodifucotetraose; LNFP I/II/III/V, lacto-N-fucopentaose-I/II/III/V; S-LNnH II, sialyllacto-N-neohexaose II.

