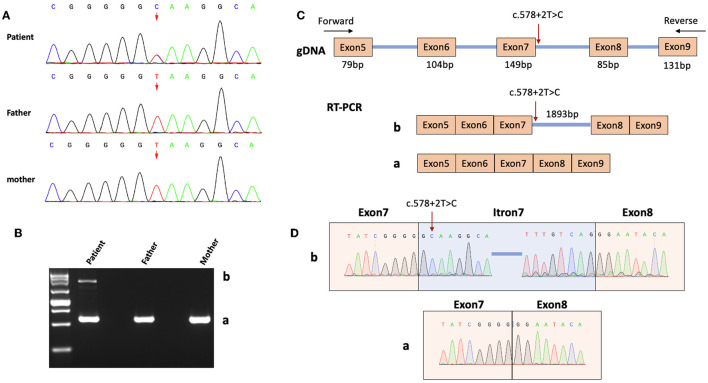
Figure 2.
Genetic diagnosis and RNA analysis. (A) Sanger sequencing results of the patient and his parents. The arrow indicates the genomic location (according to the human genome assembly GRCh37 / hg19) of the heterozygous variant NM_001032221.4:c.578+2T>C. (B) RT-PCR product analysis by agarose gel electrophoresis. A normal band (Band a) was observed in both the male patient and controls (his parents), whereas an extra band (Band b) was observed in the patient only. (C) A diagram showed the design of PCR primers for cDNA amplification and the contents of the two bands in B (Bands a and b). Red arrow indicates the variant site. (D) Sanger sequencing revealed the sequences of Bands a and b.

