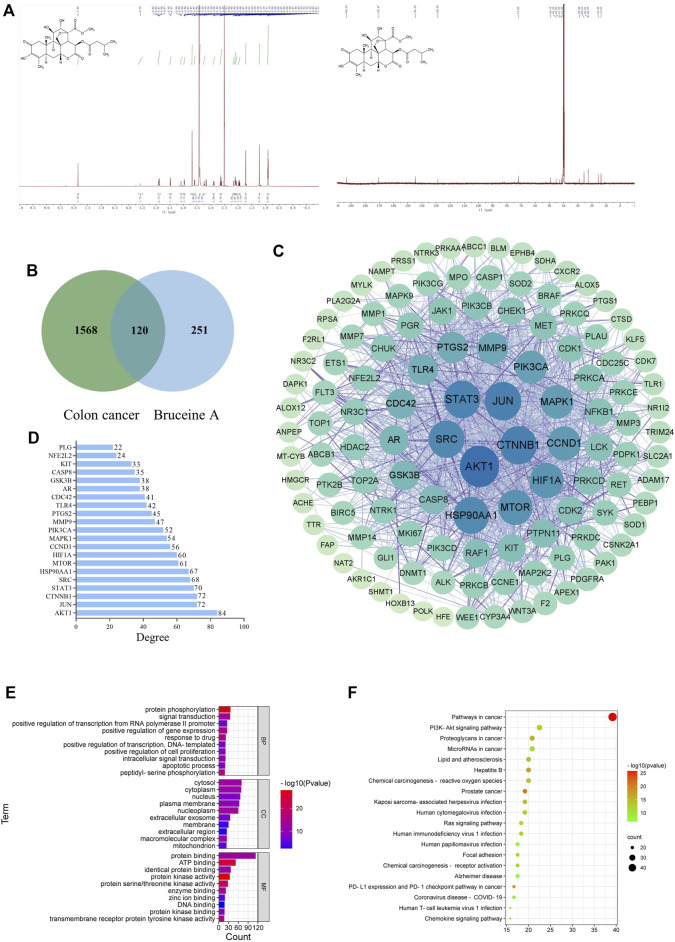
FIGURE 1.
Network pharmacology analysis. (A) The chemical structure of Bruceine (A,B) Venn diagram of Bruceine A targets and colon cancer-related targets. (C) PPI network of common targets of BA and CC. The larger the node and the darker the color is, which means the higher the degree of correlation. (D) Bar plot showing the top 21 hub genes in the PPI network. (E) The top 20 enriched KEGG pathways of target genes. (F) GO analysis of target genes.

