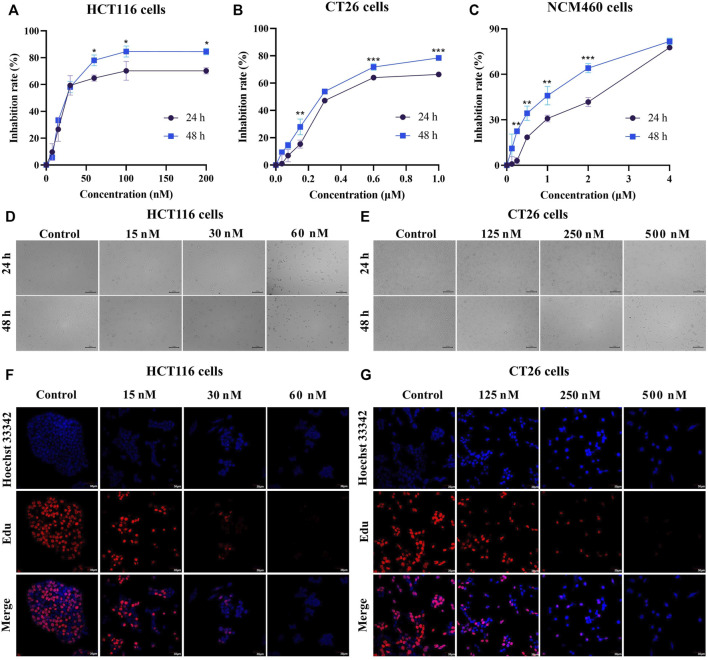
FIGURE 3.
BA inhibited cell proliferation in HCT116 and CT26 cells. (A–C) The cell inhibition rate of HCT116 (A), CT26 (B) and NCM460 (C) cells were treated with different concentrations of BA for 24 h or 48 h (D,E) The morphological changes of HCT116 (D) and CT26 (E) cells treated with BA for 24 h or 48 h (F,G) Representative images of Edu-labeled HCT116 (F) and CT26 (G) cells after 48 h of BA treatment. Red: Edu, Blue: Hoechst 33,324. *p < 0.05, **p < 0.01, ***p < 0.001, compared to the 24 h group.

