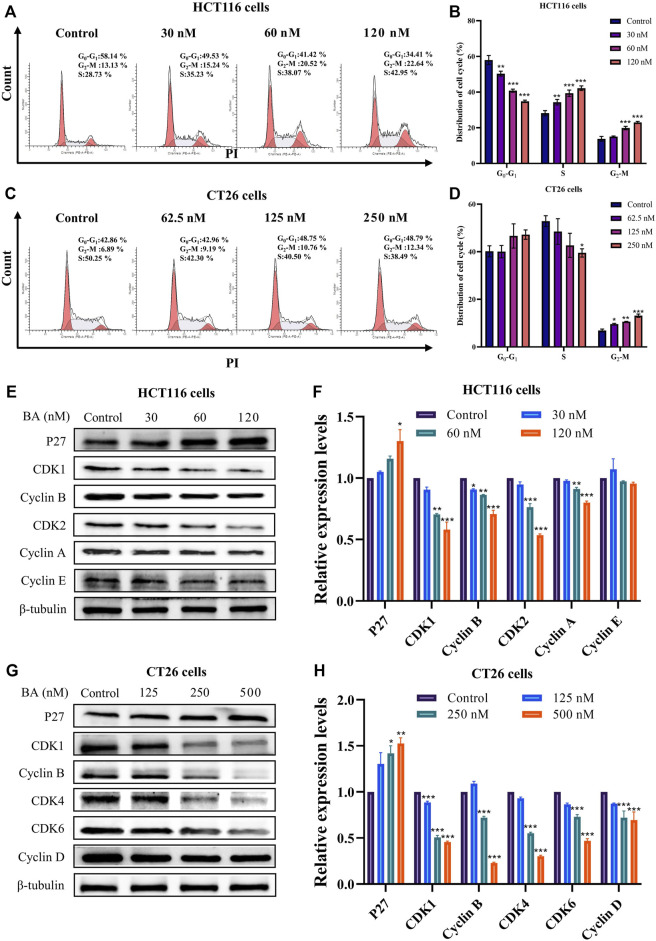
FIGURE 4.
BA induced cycle arrest and modulated the expression of the cycle-related proteins in HCT116 and CT26 cells. (A–D) Cell cycle distribution of HCT116 (A) and CT26 (C) cells treated with BA. Statistical analysis of the percentage G0/G1, S and G2/M phases of HCT116 (B) and CT26 (D) cells treated with BA. (E–H) Western blot analysis for the expression of cycle related proteins in HCT116 (E) and CT26 (G) cells treated with BA. Statistical analysis of P27, CDK1, CDK2, Cyclin E, Cyclin B and Cyclin A levels in HCT116 cells (F), and analysis of P27, CDK1, CDK4, CDK6, Cyclin B and Cyclin D levels in CT26 cells (H). The protein levels were normalized to the control group. All data were representative of three independent experiments. *p < 0.05, **p < 0.01, ***p < 0.001, compared to the control group.

