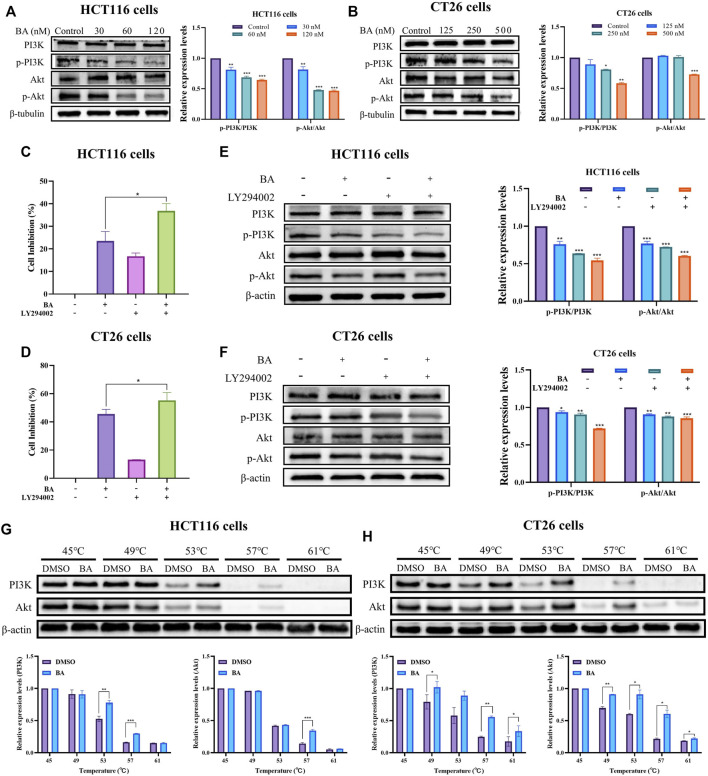
FIGURE 8.
BA inhibited the PI3K/Akt signaling pathway. (A,B) The PI3K/Akt pathway related protein expression levels of HCT116 (A) and CT26 (B) cells treated with BA were measured by western blot, and β-tubulin served as a loading control. (C,D) The cell inhibition rate of HCT116 (C) and CT26 (D) cells were treated with BA and/or LY294002 for 48 h (E,F) The PI3K/Akt pathway related protein expression levels of HCT116 (E) and CT26 (F) cells treated with BA and/or 2 LY294002 (20 μM) were measured by western blot, and β-tubulin or β-actin served as a loading control. (G,H) Western blotting intensity and standardized statistics of PI3K and Akt in HCT116 (G) and CT26 (H) cells with or without BA in CETSA test. *p < 0.05, **p < 0.01, ***p < 0.001, compared to the control group.

