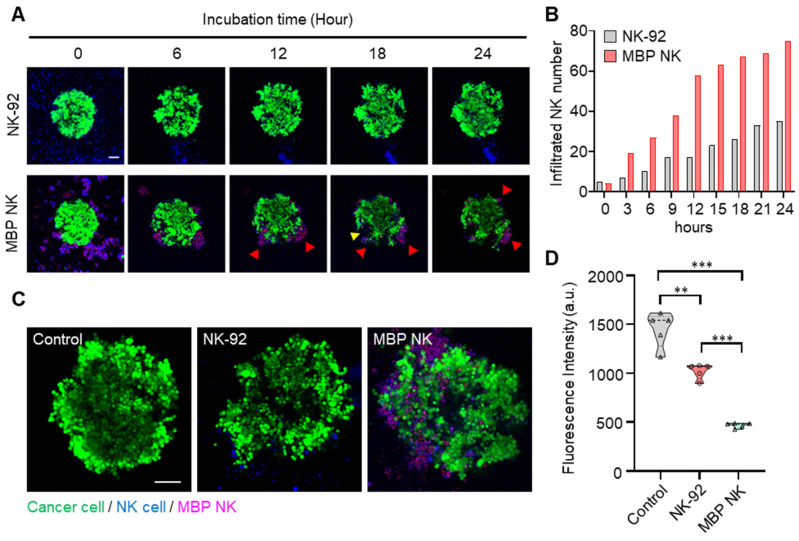
Figure 6.
The infiltration and cytolysis abilities of the MBP NK cells in the lung tumor spheroid model. (A) Time-lapse confocal images of A549 tumor spheroids stained with calcein AM and cocultured with NK cells or MBP NK cells. Red arrows indicate clusters of MBP NK cells around the tumor spheroid. The cluster of MBP NK cells exhibited effective cytolysis, creating a massive dead zone in the tumor spheroid (see the yellow arrow). (B) Number of infiltrating cells for the NK and MBP NK cells after co-cultivation with A549 spheroids for 24 hours. The number of infiltrating cells was dramatically increased in the MBP NK cells compared to the parental NK cells. (C) Representative confocal images of A549 spheroids alone and spheroids co-cultured with NK cells or MBP NK cells after 48 hours. Scale bar, 100 μm. The MBP NK cells showed more infiltration inside the tumor spheroid. (D) Quantitative analysis of live cancer cells. The cancer spheroids presented significantly weaker fluorescent signals when cocultured with the MBP NK cells. Fluorescence was analyzed by reviewing the confocal images captured after 48 hours of cocultivation (n=5). The statistical analysis was performed with an unpaired two-tailed t-test, **, ρ < 0.01; ***, ρ < 0.001.

