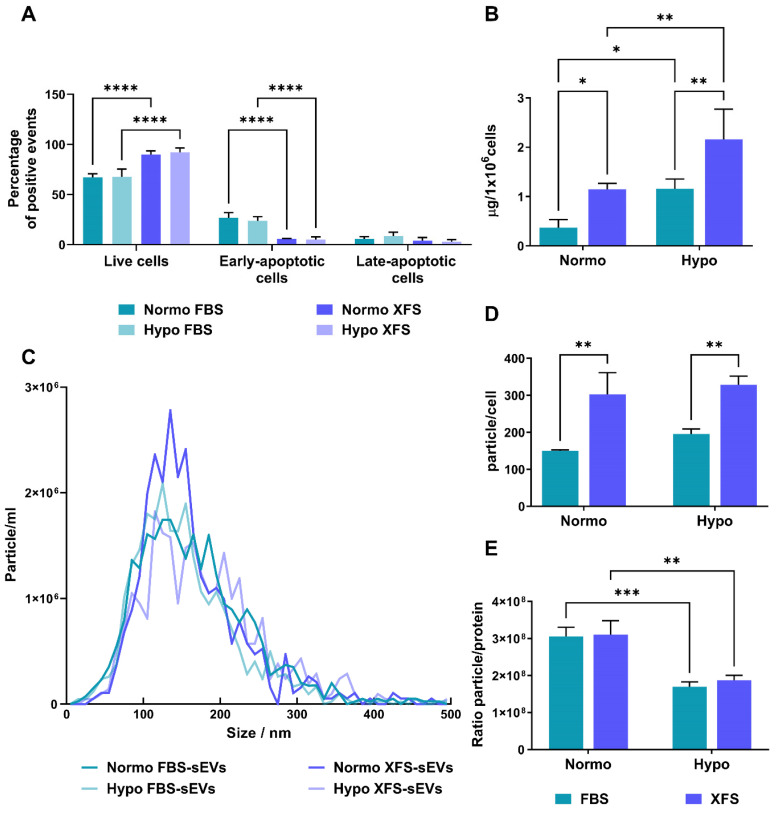
Figure 1.
Characterization of secreting cells and quantification of sEVs. (A) Evaluation of apoptosis on secreting cells by flow cytometry on both FBS and XFS-hBMSCs after 72 hours pre-conditioning in both normoxic (20% O2) and hypoxic (1% O2) culture conditions. Concurrent staining with FITC-anti-annexin V and PI was used. Error bars represent S.D. (****) p < 0.0001, two-way ANOVA. (B) Quantification of protein content on Normo and Hypo FBS-sEVs and Normo and Hypo XFS-sEVs by BCA assay. Data are normalized on cell number (μg/106 cells). Error bars represent S.D. (*) p < 0.05, (**) p < 0.01, two-way ANOVA. (C) Nanoparticle Tracking Analysis (NTA) measuring size distribution of FBS- (green) and XFS-sEVs (blue) under normoxia ad hypoxia. (D) Comparison of particle number expressed as particles/cell. Error bars represent S.D. (**) p < 0.01, two-way ANOVA. (E) Ratio particle/protein. Error bars represent S.D. (**) p < 0.01, two-way ANOVA. Data are representative of at least three independent experiments.

