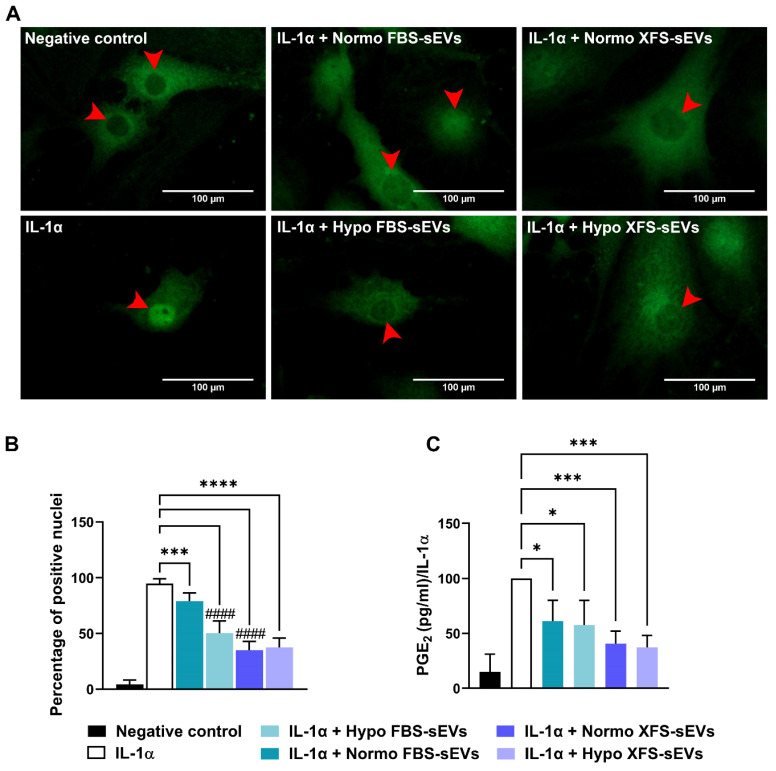
Figure 6.
Mechanism of action of sEVs on OA-hACs. (A) NF-kB nuclear translocation in OA hACs in response to sEVs treatment. Red arrows show the nucleus of the cells. Images are representative of four independent experiments. Scale bar: 100μm. (B) Quantification of NF-kB nuclear translocation, calculated as number of cells with positive nuclei on total cell number. Error bars represent S.D. (***) p < 0.001, (****) p < 0.0001, comparison vs. IL-1a, (####) p < 0.0001, comparison vs. IL-1a + Normo FBS-sEVs, one-way ANOVA. (C) PGE2 ELISA quantification, expressed as percentage of positive control (IL-1α). Error bars represent S.D. (*) p < 0.05, (***) p < 0.001, one-way ANOVA.

