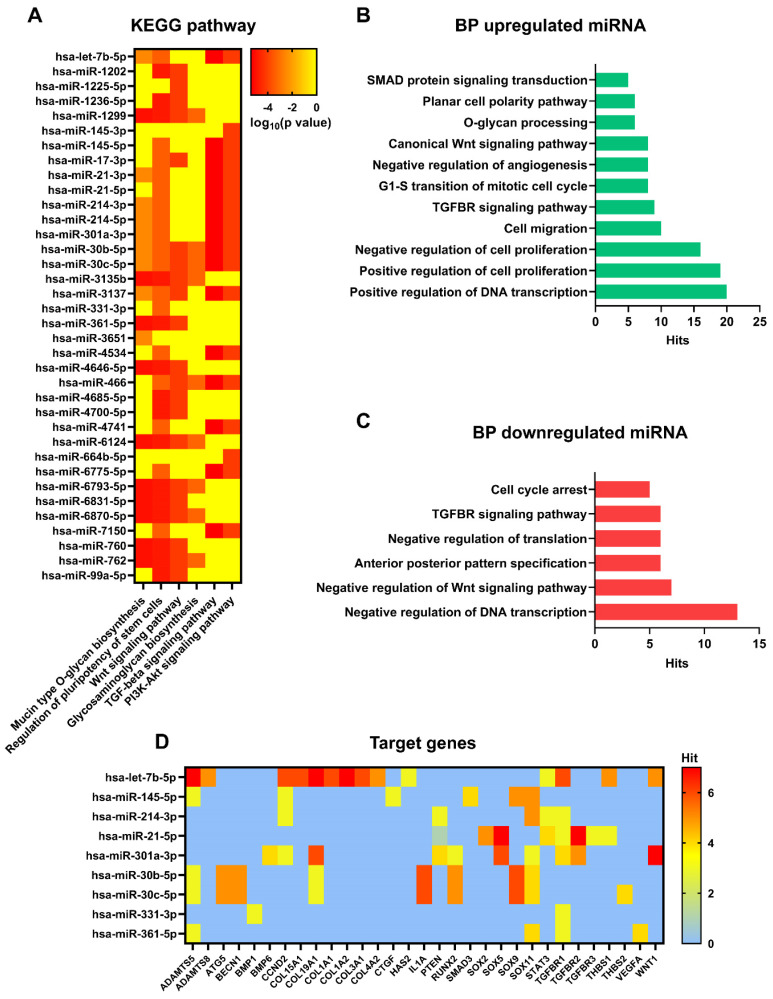
Figure 8.
Pathway, biological processes, and target genes of expressed miRNA. (A) Heat map showing main pathways regulated by expressed miRNA, analysed with DIANA myRPath 3.0. Colour scale is representative of log10 (p value). (B) Biological processes of upregulated miRNA, analysed with DIANA myRPath 3.0. (C) Biological processes of downregulated miRNA, analysed with DIANA myRPath 3.0. (D) Heat map showing target genes regulated by expressed miRNA, analysed with miRsystem. Colour scale is representative of hits number.

