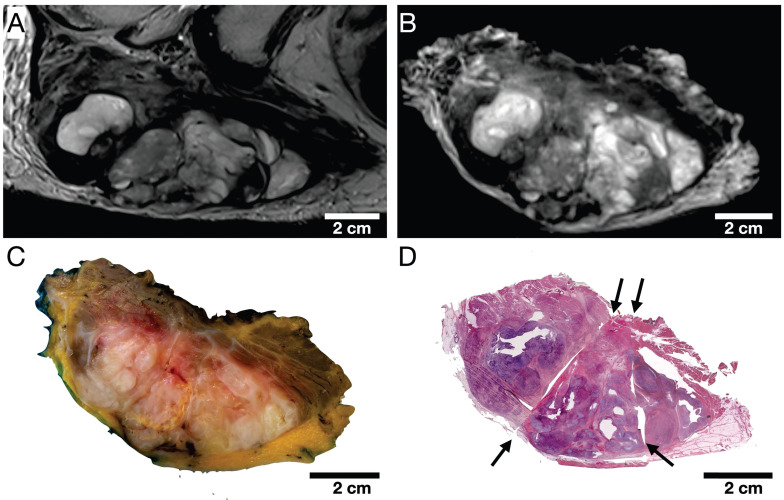
Figure 5.
Representative cranial section of an MFS (patient 1). Visual assessment of (A) axial in vivo T2w, (B) axial ex vivo T2w, (C) macroscopic section, and (D) H&E stained microtomy section shows a high spatial and morphological correlation. Note the light deformations of the microtomy section (D) at the cutting edges (black arrows) as well as split and microtomy artifacts (white arrows).

