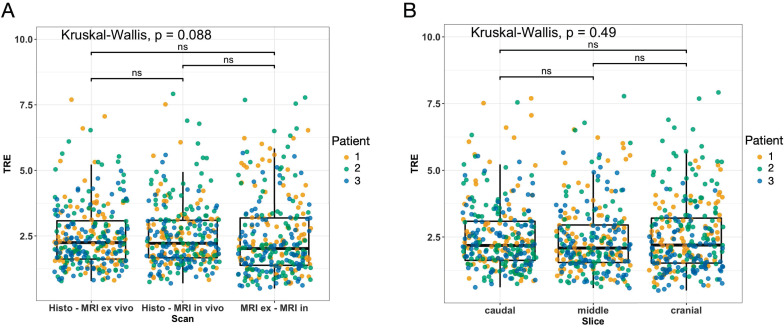
Figure 6.
Results of the target registration error analysis illustrated as boxplots combined with jitter plots. (A) Pairs of MRI and histology sections: left, histology - ex vivo MRI; middle, histology - in vivo MRI; right, ex vivo - in vivo MRI. (B) Sections of the caudal (left), middle (middle), and cranial (right) STS parts. Boxplots: middle line represents the median; the upper and lower ends of the box represent the 75th and 25th percentiles, respectively. Jitter plot: Dots indicate landmarks color-coded for each patient. Y-axis: target registration error (TRE) in mm.

