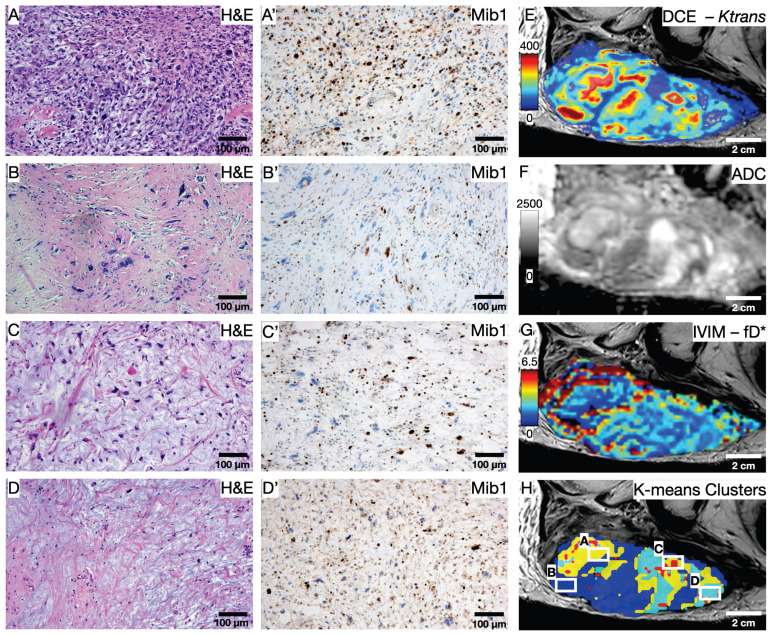
Figure 7.
Initial comparison between (immuno)histology and quantitative mpMRI parameters. (A-D) H&E and (A'-D') Mib1 stainings in 100x magnification show the four predominant histology patterns on the section: Cell-rich - vital tumor cells (A and A'); sclerotic background - vital tumor cells (B and B'); myxoid - vital tumor cells (C and C'); predominant myxoid - single vital tumor cells (D and D'). (E-H) Exemplary parametric maps for each quantitative MRI sequence: DCE - Ktrans (E); DWI - ADC (F); IVIM - fD* (G). (H) Result of the K-means clustering based on all 8 available parametric Maps; White squares indicate the area of the histological images.

